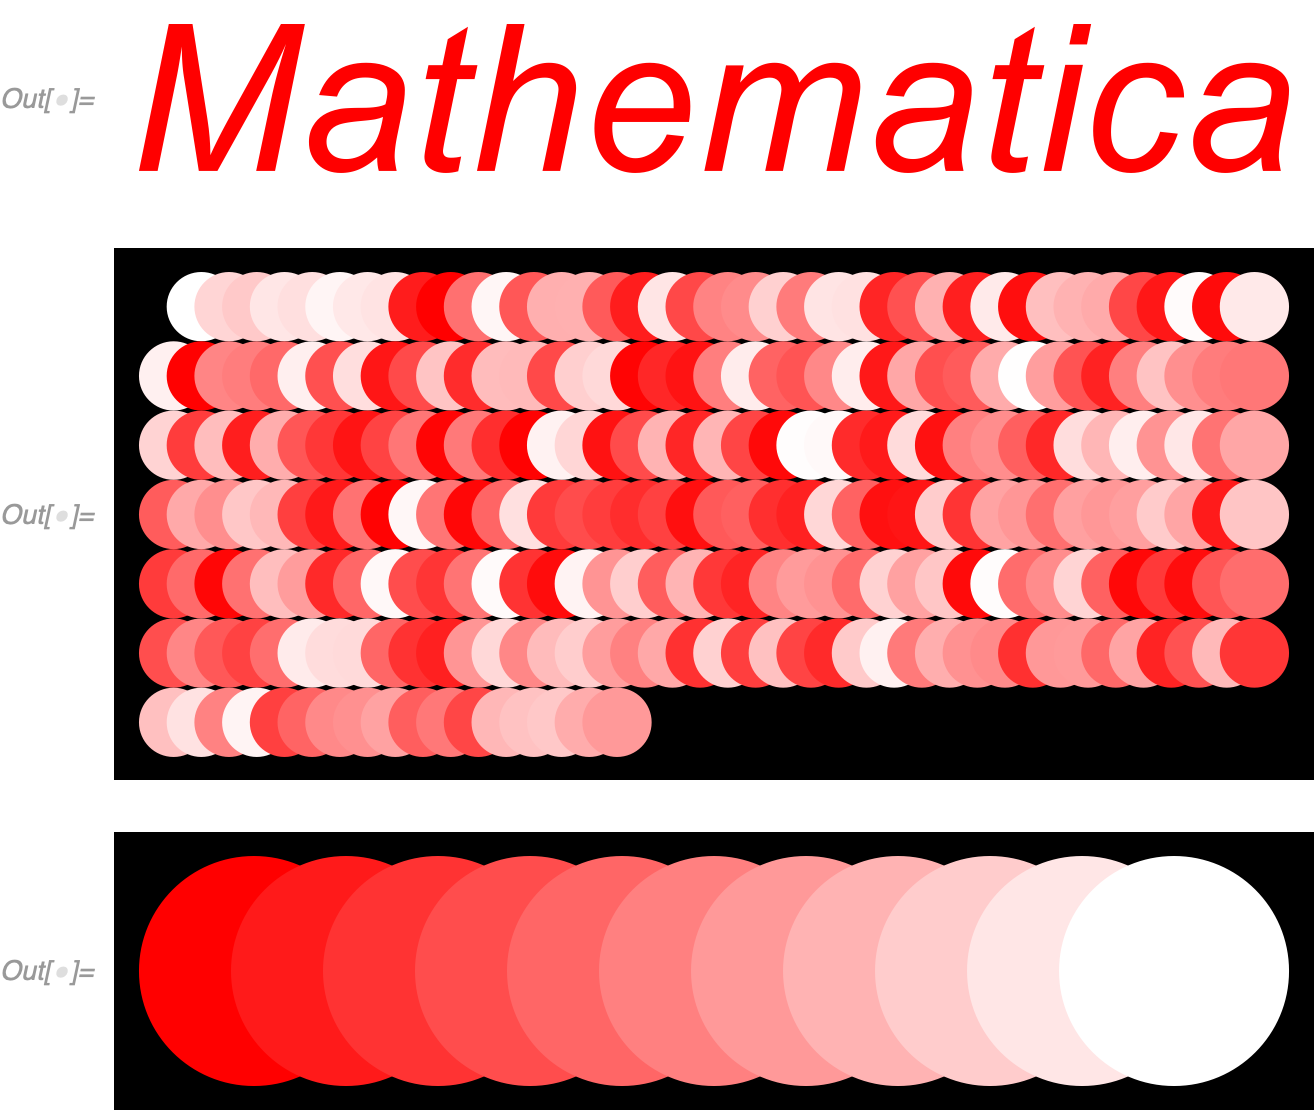
The following code uses Graphics to display text "Mathematica" of pure red color on white background.
Then it displays all colors used in the rasterized version of the graphics.
Due to anti-aliasing we are of course expecting to have more colors than just pure red and pure white ones.
But why all different shades/tints of yellow, orange, pink, violet and brown???
I would expect to have just tints of red that are present in blending between red color (of text) and white color (of background) as we can see in third image.
gr = Graphics[{Text[
     Style["Mathematica", RGBColor[1, 0, 0], Italic, 30], {0, 0}]},
   PlotRange -> {-1/4, 1/4}] // Rasterize
colors = Flatten[ImageData[gr, "Byte"], 1] // DeleteDuplicates;
Graphics[Table[{RGBColor @@ (colors[[x]]/255), Disk[{8 x/10, 0}]}, {x,
    1, Length[colors]}], ImageSize -> {Automatic, 100},
 Background -> Black]
Graphics[Table[{Blend[{Red, White}, x], Disk[{8 x, 0}]}, {x, 0, 1,
   1/10}], ImageSize -> {Automatic, 100}, Background -> Black]
Clear[gr, colors]
Is it a correct behavior or a bug?


