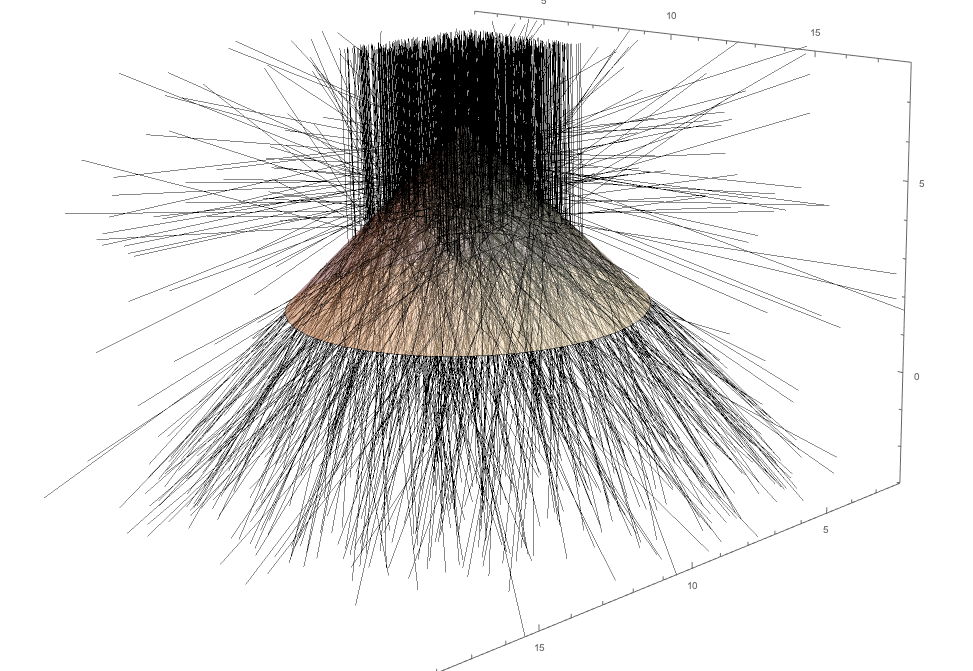
I used Tim Laska's solution here for raytracing, and modelled 10000 photons impinging onto a cone.
shape = Cone[{{7.5, 7.5, 1}, {7.5, 7.5, 6}}, 5]

(* 10 000 photons *)
data2 = Import[
    "https://raw.githubusercontent.com/Tb8854/overflowquestion/master/\
test", "Data"][[1]];
data2 = ToExpression[data2];

(* plot first 1000 *)
data = data2[[1 ;; 1000]];
data = Flatten[data[[#]], 2] & /@ Range[Length[data]];
lines = Line[#] & /@ data;
Graphics3D[{lines, {Opacity[0.4], shape}},
 PlotRange -> {{2, 18}, {2, 18}, {-3, 8}}, Axes -> True,
 Boxed -> False]
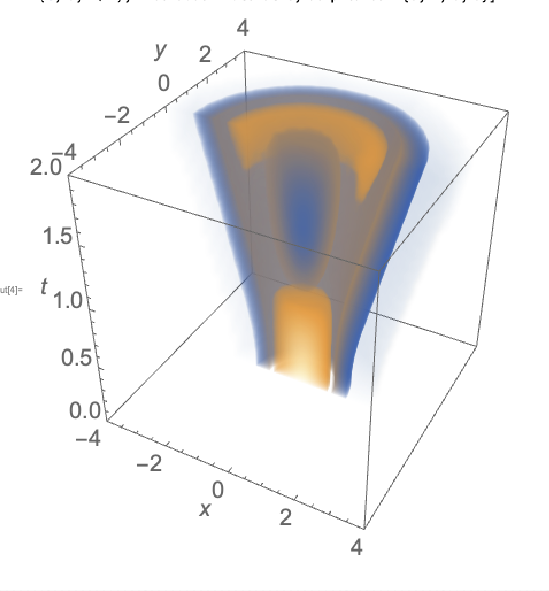
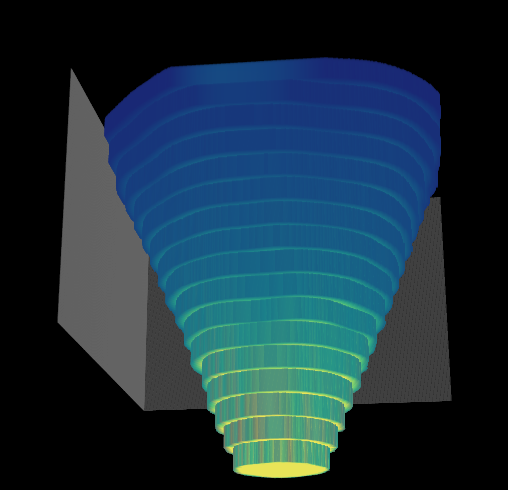
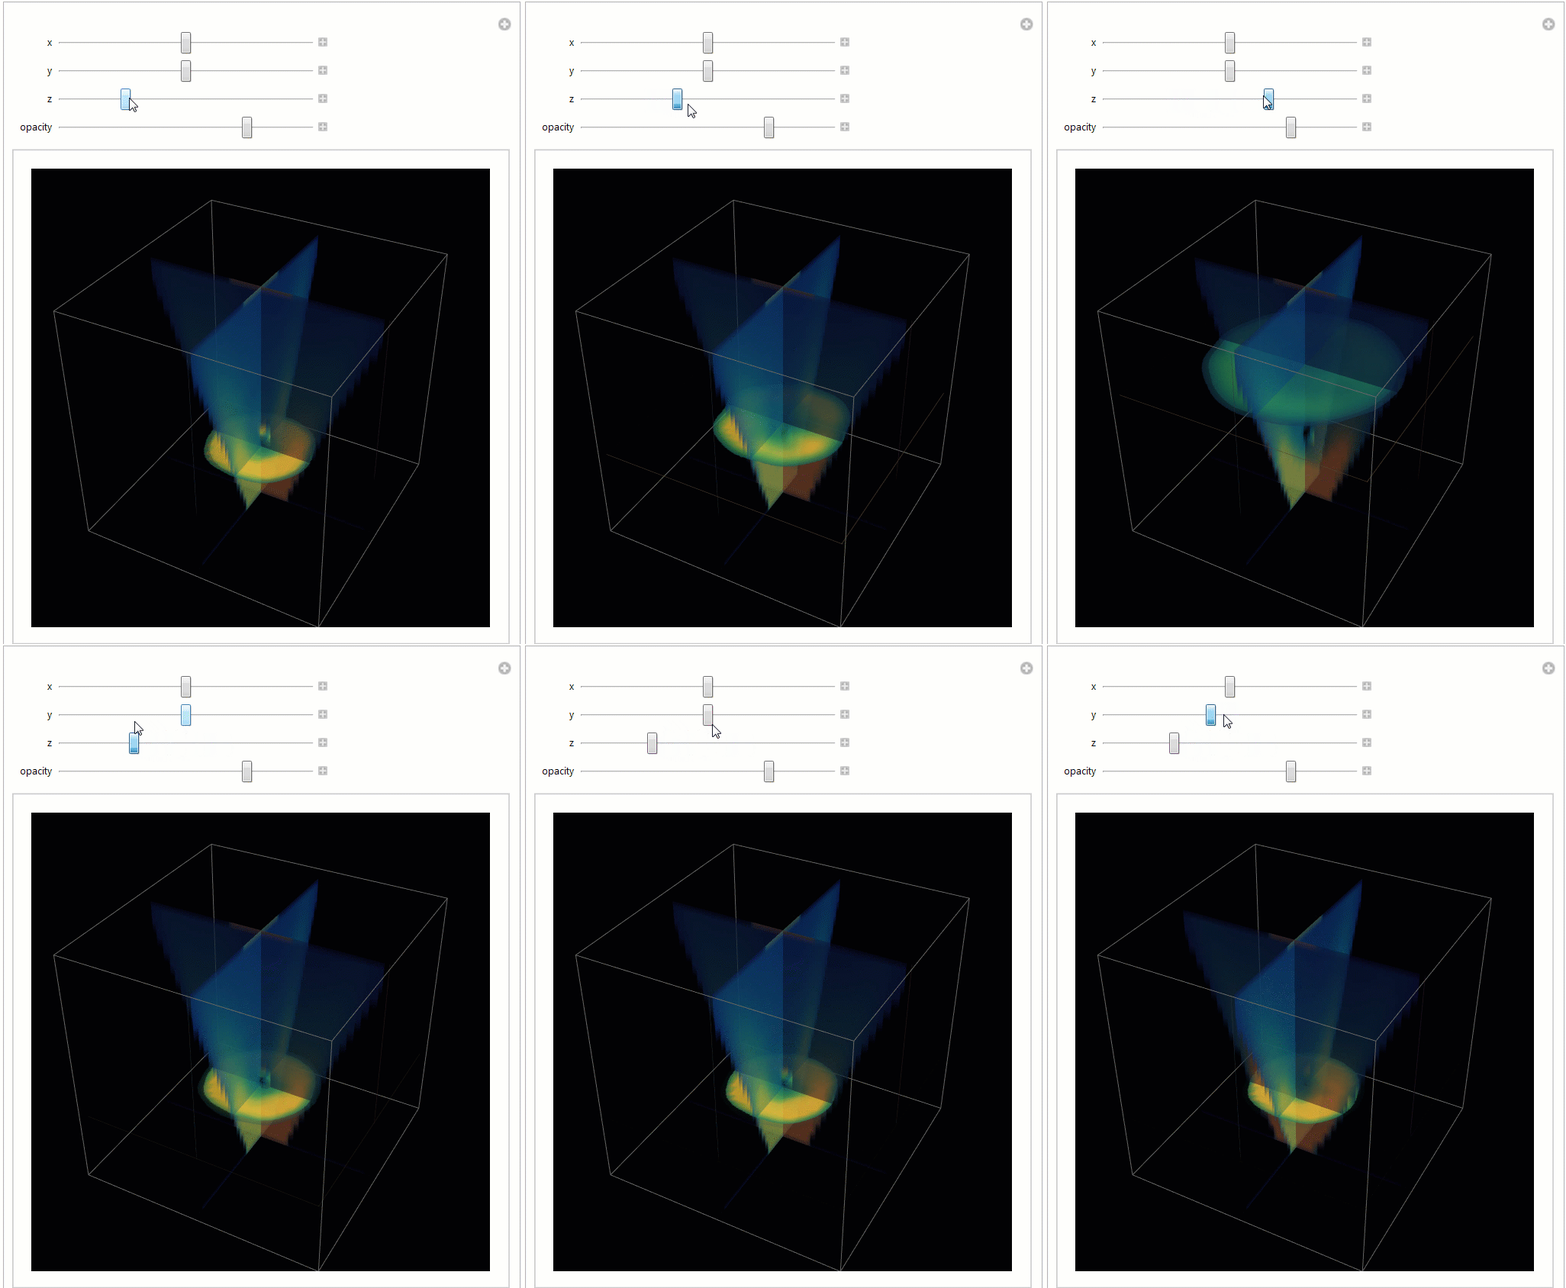
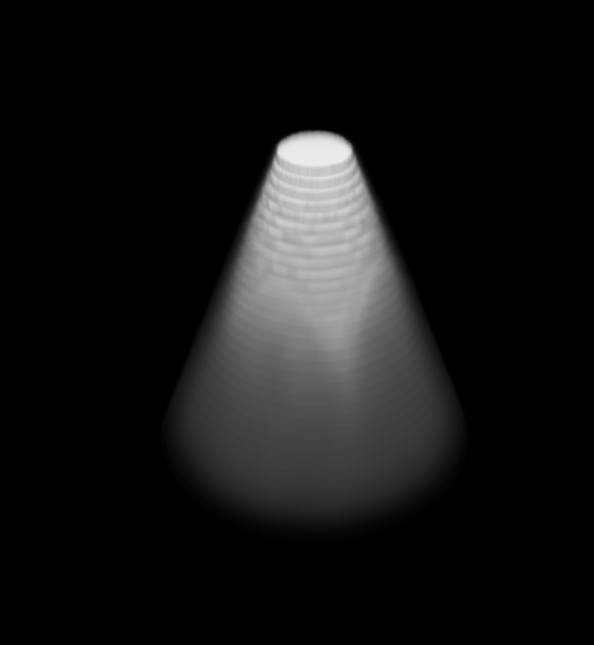
But, I want to see the flux, i.e. the number of rays (i.e. lines) per unit area in the material. Maybe something like this:
Where, if I a higher density of lines the cone, the redder the cone should be. I don't think the rays in the first image effectively show the spreading out of the rays when they enter the cone.
A Poor Solution
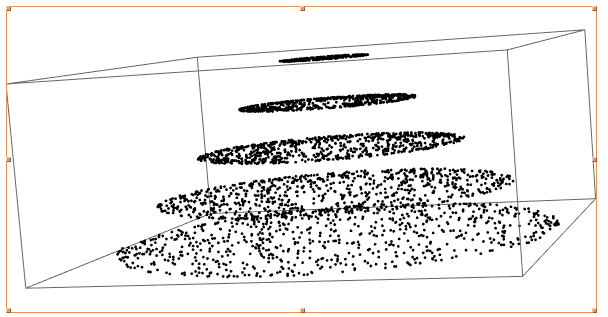
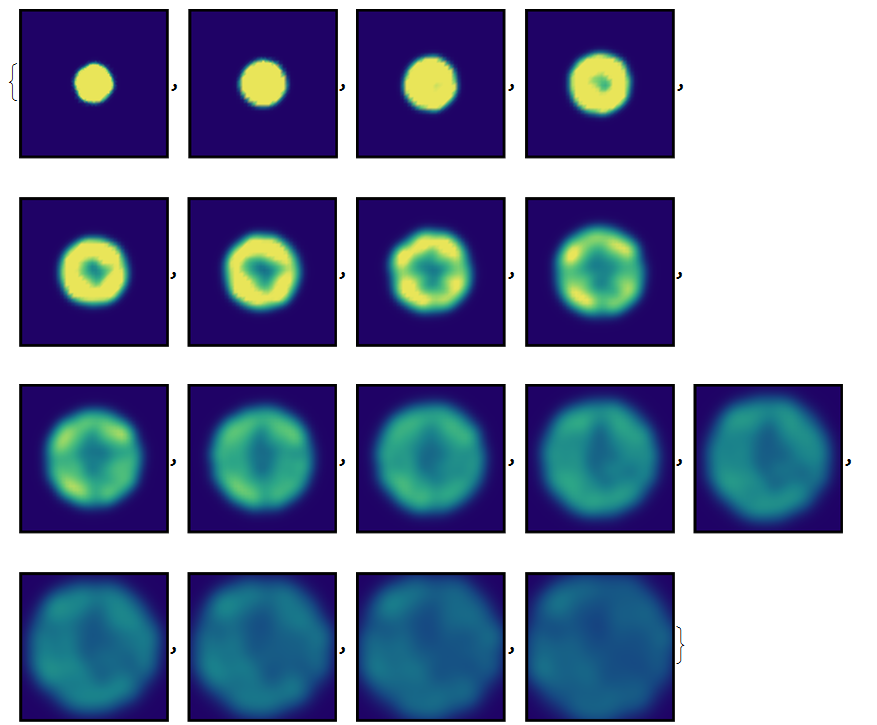
I've developed a poor 2D solution, beware - it takes a while (2 minutes). What it does is make slices in the cone, and check if there is an intersection. It works okay.
datastore = ConstantArray[{}, (5)];
points = ConstantArray[{}, {(5), Length[data]}];
(* prevent hitting the edge *)
positionerror = 0.01;

For[j = 5, j >= 1, j = j - 1,
 Print[j];
 number = 0;
 plane = InfinitePlane[{10, 10,
    j + positionerror}, {{0, 1, 0}, {1, 0, 0}}];

 Monitor[For[i = 1, i <= Length[data], i++,
   line = Line[data[[i]]];
   intersection = RegionIntersection[plane, line, shape];
   points[[j, i]] = intersection;
   If[intersection === EmptyRegion[3],
    Continue[];,
    number = number + 1;
    ];

   area = Area[Region[RegionIntersection[plane, shape]]];
   datastore[[j]] = {number, area, number/area};

   ], ProgressIndicator[i, {1, Length[data]}]]]


For[i = 2.01, i <= 6, i++,
  pointsplot =
   Select[Flatten[points[[2 ;;, ;; , 1]], 2], Length[#] == 3 &];
  pointsplot = Select[pointsplot, #[[3]] == i &];
  pointsplot = pointsplot[[;; , {1, 2}]];

  data = BinCounts[pointsplot, {2, 13, 0.1}, {2, 13, 0.1}];
  data = GaussianFilter[data, 2];
  Print[ListDensityPlot[data, ColorFunction -> "BlueGreenYellow",
    PlotRange -> All]]
  ];

Graphics3D[{points}]
But does anyone have any ideas how to maybe represent the flux in 3D?

