1
$\begingroup$

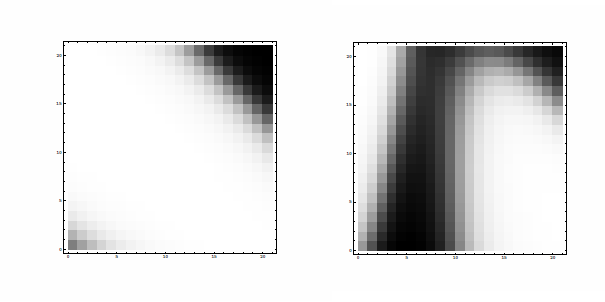
I need to produce some plots that look like these but I'm not sure what they are called in mathematica, can anyone identify them ?
picture

Update: I want to plot triples of the form (xvalue, yvalue, intensity) in a graph like that

$\endgroup$
3
  • $\begingroup$ Try DensityPlot! $\endgroup$ Commented Mar 27, 2013 at 15:17
  • $\begingroup$ DensityPlot appears to be for plotting functions, I have triples that I want to plot corresponding to (xvalue, yvalue, intensity) Is there a function for doing this ? $\endgroup$ Commented Mar 27, 2013 at 15:24
  • $\begingroup$ It's probably ArrayPlot. There's also MatrixPlot, Image, Graphics[Raster[...]], and ListDensityPlot (which can interpolate). For triples you need ListDensityPlot or see this $\endgroup$
    – Szabolcs
    Commented Mar 27, 2013 at 15:26

1 Answer 1

1
$\begingroup$

It might be ListDensityPlot with an InterpolationOrder of 0 and a black/white ColorFunction

https://i.sstatic.net/pa96b.jpg

$\endgroup$

Not the answer you're looking for? Browse other questions tagged or ask your own question.