1
$\begingroup$

I have a couple of {x,y,z} points

a = {{0, 1, 0.}, {50, 1, 0.018931}, {100, 1, 0.02}, {0, 2, 0.}, {50, 2, 0.131}, {100, 2, 0.2}};

and I'm visualizing them with

ListPointPlot3D[a, PlotLegends -> Automatic, ImageSize -> 400, ColorFunction -> "Rainbow", PlotStyle -> PointSize[0.03], PlotRange -> {0, 1}]

it gives me this view:
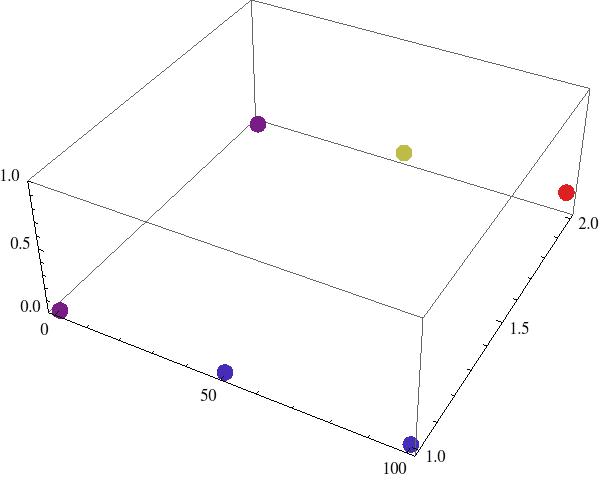
graph

Now I don't need to see this graph in 3D because the color already codes for height. So is there a function that would allow me to see this graph "from above"? Ideally, each {x,y,z} point would be represented by a big square of coordinates {x,y} and of color representing z. I would also like to be able to label all squares with the same y, as they represent different entities (we can imagine the x axis is time (from 0 to 100), and I have recorded sound levels (z) in two conditions "noisy" (y = 0) and "quiet" (y = 1). I would like to label "noisy" and "quiet" close to my data).

So in the end I could get something like this (I took this image on the internet so of course labels are wrong, but it gives this idea of a coloured matrix) :
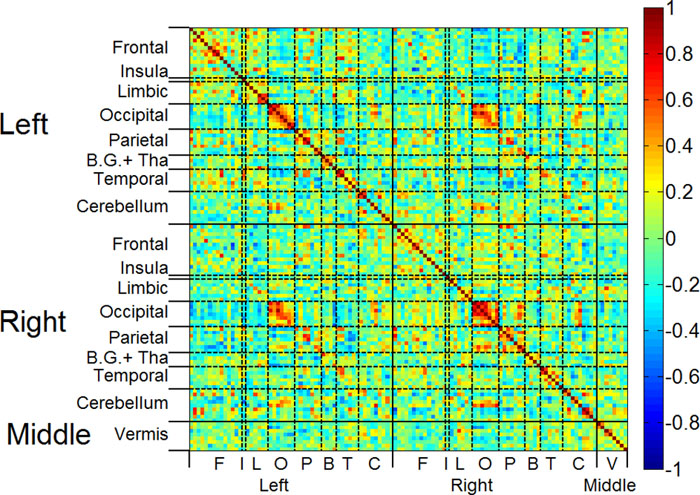
enter image description here

$\endgroup$
2
  • 1
    $\begingroup$ Then why don't you just use ArrayPlot? $\endgroup$
    – Federico
    Commented Mar 26, 2013 at 18:02
  • $\begingroup$ @Federico I'm looking into ArrayPlot right now, just need to reorganize my data a little bit, and see how I can use labels. I just didn't know the name of this function... $\endgroup$
    – Sulli
    Commented Mar 26, 2013 at 18:42

4 Answers 4

1
$\begingroup$

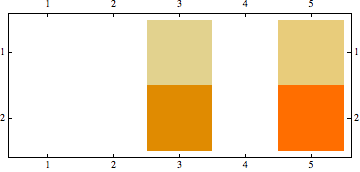
If you would like to use ArrayPlot or MatrixPlot, first you need to convert your data into a matrix format. You can use SparseArray for this. Here's an example:

MatrixPlot[SparseArray[{#1/25 + 1, #2} -> #3 & @@@ a]]

Mathematica graphics

Make sure that the matrix indexes will start from 1, not from 0. I needed to add 1 to the first index for this. I also rescaled the first index by 25 (a random choice) in order not to get a 100 by 2 matrix which would not be that useful to look at. The unspecified elements are taken to be 0 here, but you can specify an alternative, or rescale by 50 so you won't have any empty elements.

$\endgroup$
4
$\begingroup$

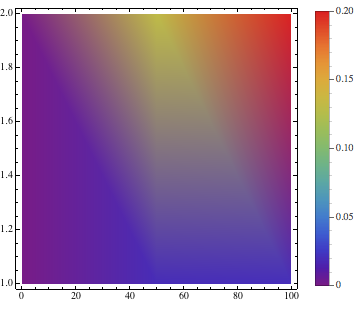
I wonder if this gets you something closer to what you'd like:

a = {{0, 1, 0.}, {50, 1, 0.018931}, {100, 1, 0.02}, {0, 2, 0.}, {50,2, 0.131}, {100, 2, 0.2}};
ListDensityPlot[a, PlotLegends -> Automatic, ImageSize -> 400, ColorFunction -> "Rainbow", PlotRange -> {0, 1}]

Mathematica graphics

Wolfram also has some useful data visualization tutorials. See: Visualization: Data Visualization Quick Start

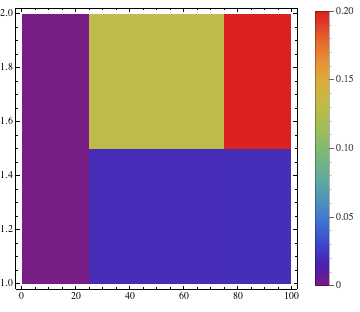
If the points are on a rectangular grid, it is often useful to use InterpolationOrder -> 0 in ListDensityPlot:

Mathematica graphics

$\endgroup$
5
  • $\begingroup$ I hope you don't mind my edit, please change it further if you like :) I thought this is useful info for this case. $\endgroup$
    – Szabolcs
    Commented Mar 26, 2013 at 21:23
  • $\begingroup$ @Szabolcs -- I don't mind at all. Thanks. $\endgroup$
    – Jagra
    Commented Mar 27, 2013 at 3:07
  • $\begingroup$ I explored the ListDensityPlot function before ListPointPlot3D actually but with this function it's not easy to distinguish data for "noisy" and "quiet" conditions. It's better with InterpolationOrder -> 0 but still, the graph doesn't look quite natural, the y axis for example is not continuous in my dataset. I don't know if I'm clear? That's why probably ArrayPlot is better for what I want to do. @Szabolcs $\endgroup$
    – Sulli
    Commented Mar 27, 2013 at 8:38
  • $\begingroup$ @SullivanOrlean I posted an answer showing how to use matrix plotting functions (MatrixPlot/ArrayPlot/Image/Raster/etc.). Does this help? $\endgroup$
    – Szabolcs
    Commented Mar 27, 2013 at 14:23
  • $\begingroup$ @Szabolcs yes it helps! $\endgroup$
    – Sulli
    Commented Mar 27, 2013 at 15:14
4
$\begingroup$
Graphics[{
  PointSize[.025], {Hue[3 #3], Point[{#1, #2}]} & @@@ a, 
  Text["noisy", {0, 1}, {1, 1}], Text["quiet", {0, 2}, {1, 1}]}, 
  AspectRatio -> 1/2]

Mathematica graphics

or

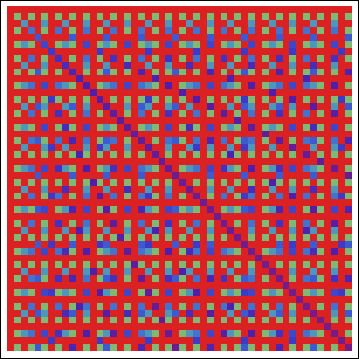
ArrayPlot[1/Array[GCD, {50, 50}],
  ColorFunction -> "Rainbow", ColorFunctionScaling -> True]

Mathematica graphics

$\endgroup$
0
1
$\begingroup$

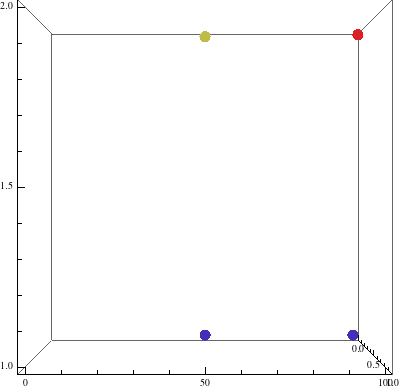
From above is easy:

a = {{0, 1, 0.}, {50, 1, 0.018931}, {100, 1, 0.02}, {0, 2, 0.}, 
 {50, 2, 0.131}, {100, 2, 0.2}};
ListPointPlot3D[a, 
   PlotLegends -> Automatic, 
   ImageSize -> 400, 
   ColorFunction -> "Rainbow", 
   PlotStyle -> PointSize[0.03], 
   PlotRange -> {0, 1}, 
   ViewPoint -> Top]

picture

$\endgroup$
4
  • $\begingroup$ This is from just the top of the bounding box, which still makes it 3D. I think the OP wants a 2D view (a projection), which can be obtained with ViewPoint -> {0, ∞, 0} $\endgroup$
    – rm -rf
    Commented Mar 26, 2013 at 17:59
  • $\begingroup$ ViewPoint -> {0, 0, ∞}. EDIT: damn 35 seconds late! :D $\endgroup$
    – Federico
    Commented Mar 26, 2013 at 17:59
  • $\begingroup$ that's the idea a 2D box, but something nicer (like the example in my edited question above) would be easier to read. @rm-rf $\endgroup$
    – Sulli
    Commented Mar 26, 2013 at 18:02
  • $\begingroup$ Ah, I misunderstood the question... :( $\endgroup$
    – cormullion
    Commented Mar 26, 2013 at 18:03

Your Answer

By clicking “Post Your Answer”, you agree to our terms of service and acknowledge you have read our privacy policy.

Not the answer you're looking for? Browse other questions tagged or ask your own question.