3
$\begingroup$

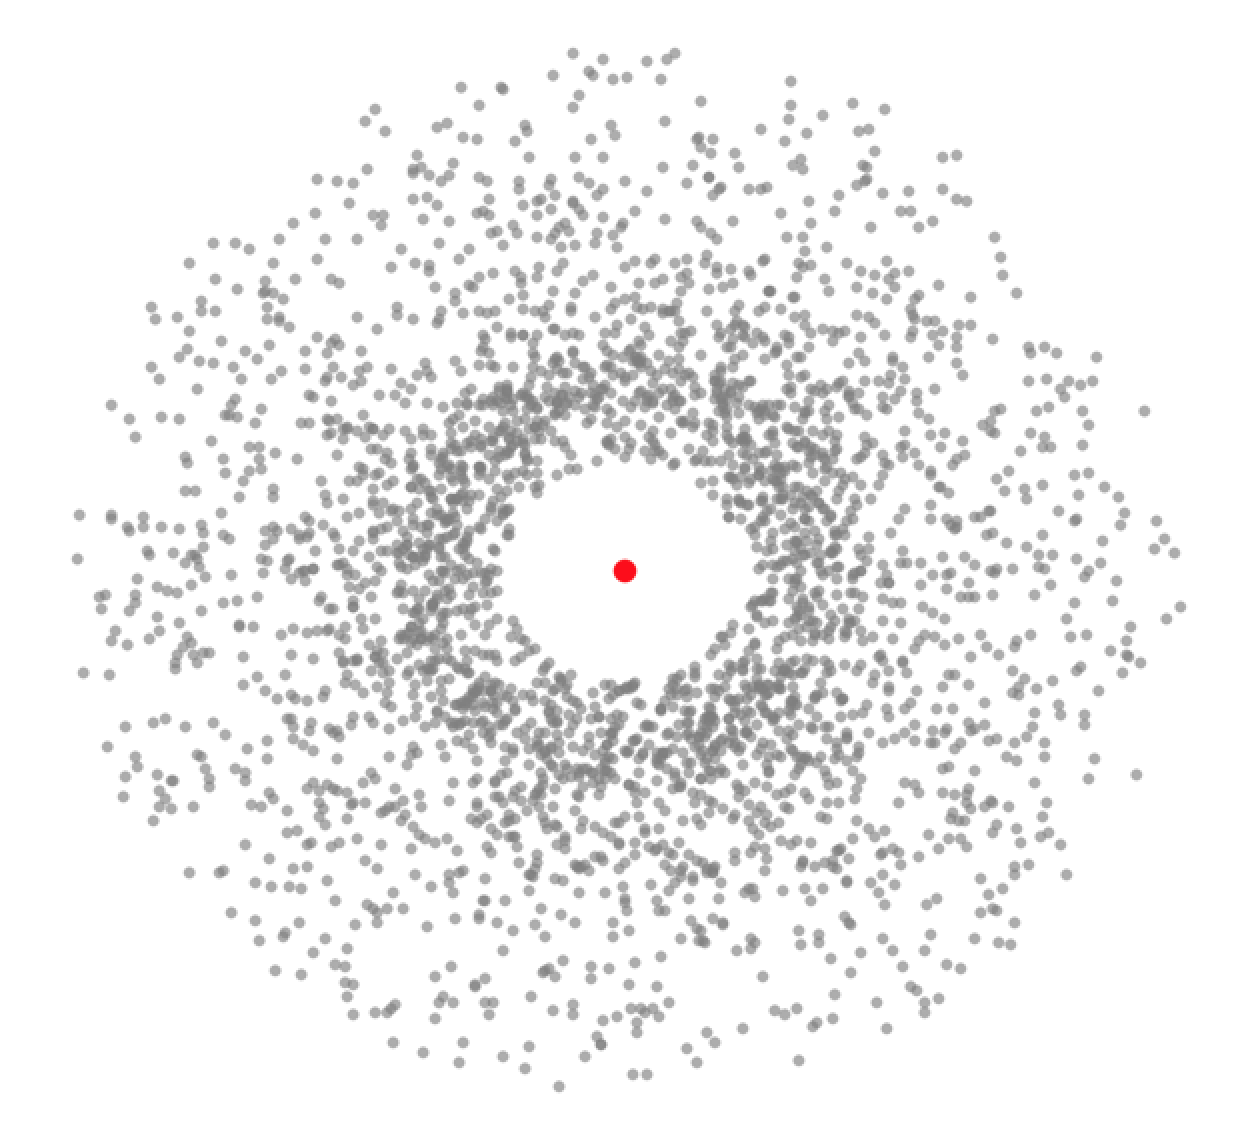
I would like to plot a graph of a random-generated list of points, so that they decay a little bit by moving from the origin. So far I wrote this piece of code, which seems to give me the desired output:

ClearAll[Evaluate[$Context <> "*"]]

MAXITER = 10;
Array[f, MAXITER, 0];


For[i = 0, i < MAXITER, i++, 

  ppXst = 1/(i + 1) * 1000;

  v = i/MAXITER;
  strip = 2/MAXITER;

    If[i == 0, strip == Abs[strip]];

  CircularDistribution[num_] :=

   Table[{Sqrt[RandomReal[{If[i == 0, .05, v], v + strip}]] {Cos[#], 
         Sin[#]} & //@ Random[Real, {0, 2 Pi}]}, {num}];

  f[i] = ListPlot[
    CircularDistribution[ppXst],
    AspectRatio -> 1, 
    ImageSize -> Medium,
    Axes -> False, 
    PlotStyle -> {{Gray, Opacity[.4], PointSize[.01]}}
    ];

  ];

Show[
 {Table[f[i], {i, 0, MAXITER - 1}],  
  Graphics[{Red, PointSize[.02],  Point[{0, 0}]}]}, 
 PlotRange -> All, 
 ImageSize -> Large
 ]

enter image description here

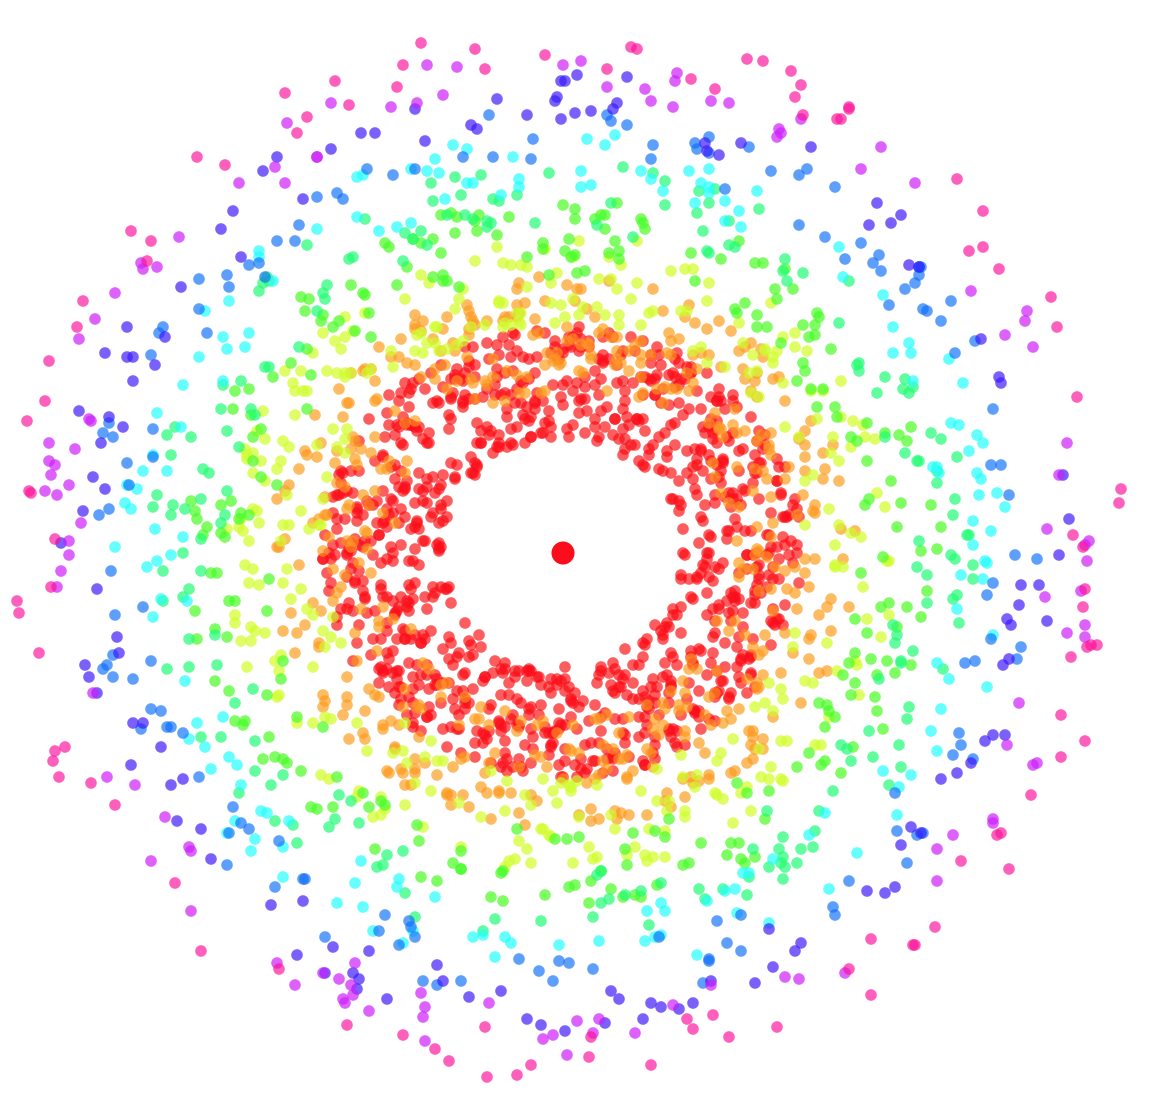
Now, what I really need is to color the points depending on the distance between them and the origin. The problem is that I did't find out a way to access the single point distance from the origin in the Show command, nor I can figure out how to color ListPlot by ListPlot in order to obtain an uniform coloured plot depending on the distance of the single point. I only get near what I want by doing so:

MAXITER = 10;
Array[f, MAXITER, 0];


For[i = 0, i < MAXITER, i++, 

  ppXst = 1/(i + 1) * 1000;
  v = i/MAXITER;
  strip = 2/MAXITER;
  If[i == 0, strip == Abs[strip]];

  CircularDistribution[num_] :=

   Table[{Sqrt[RandomReal[{If[i == 0, .05, v], v + strip}]] {Cos[#], 
         Sin[#]} & //@ Random[Real, {0, 2 Pi}]}, {num}];

  f[i] = ListPlot[
    CircularDistribution[ppXst],
    AspectRatio -> 1, 
    ImageSize -> Medium,
    Axes -> False, 
    PlotStyle -> {{Hue[v], Opacity[.4], PointSize[.01]}}
    ];

  ];

Show[
 {Table[f[i], {i, 0, MAXITER - 1}],  
  Graphics[{Red, PointSize[.02],  Point[{0, 0}]}]}, 
 PlotRange -> All, 
 ImageSize -> Large
 ]

enter image description here

which is not really what I want, as it's coloured per strip and not per single point distance. Also, if it's possible, I would like to superimpose to the final graph a Legend, similar to the color map of the ContourPlot which is easily achievable with PlotLegends-> Automatic, to show the distance associated to the color.

$\endgroup$

2 Answers 2

5
$\begingroup$

I define the f[i] as follows in your for loop to get all the points as a list.

f[i] = CircularDistribution[ppXst];

Then get all the points as a list.

pt = (Flatten /@ Flatten[Table[f[i], {i, 0, MAXITER - 1}], 1]);

Now you define a radial color function.

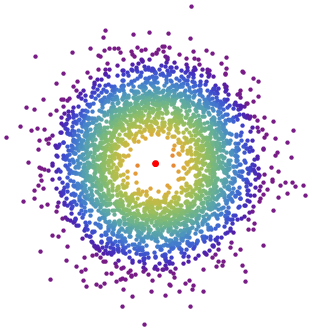
col = Function[{x, y}, ColorData["SolarColors"][Sqrt[x^2 + y^2]]];
Graphics[{{Red, PointSize[.02], 
   Point[{0, 0}]}, {Directive[col @@ #, [email protected]], PointSize[.01], 
     Point[#]} & /@ pt}]

enter image description here

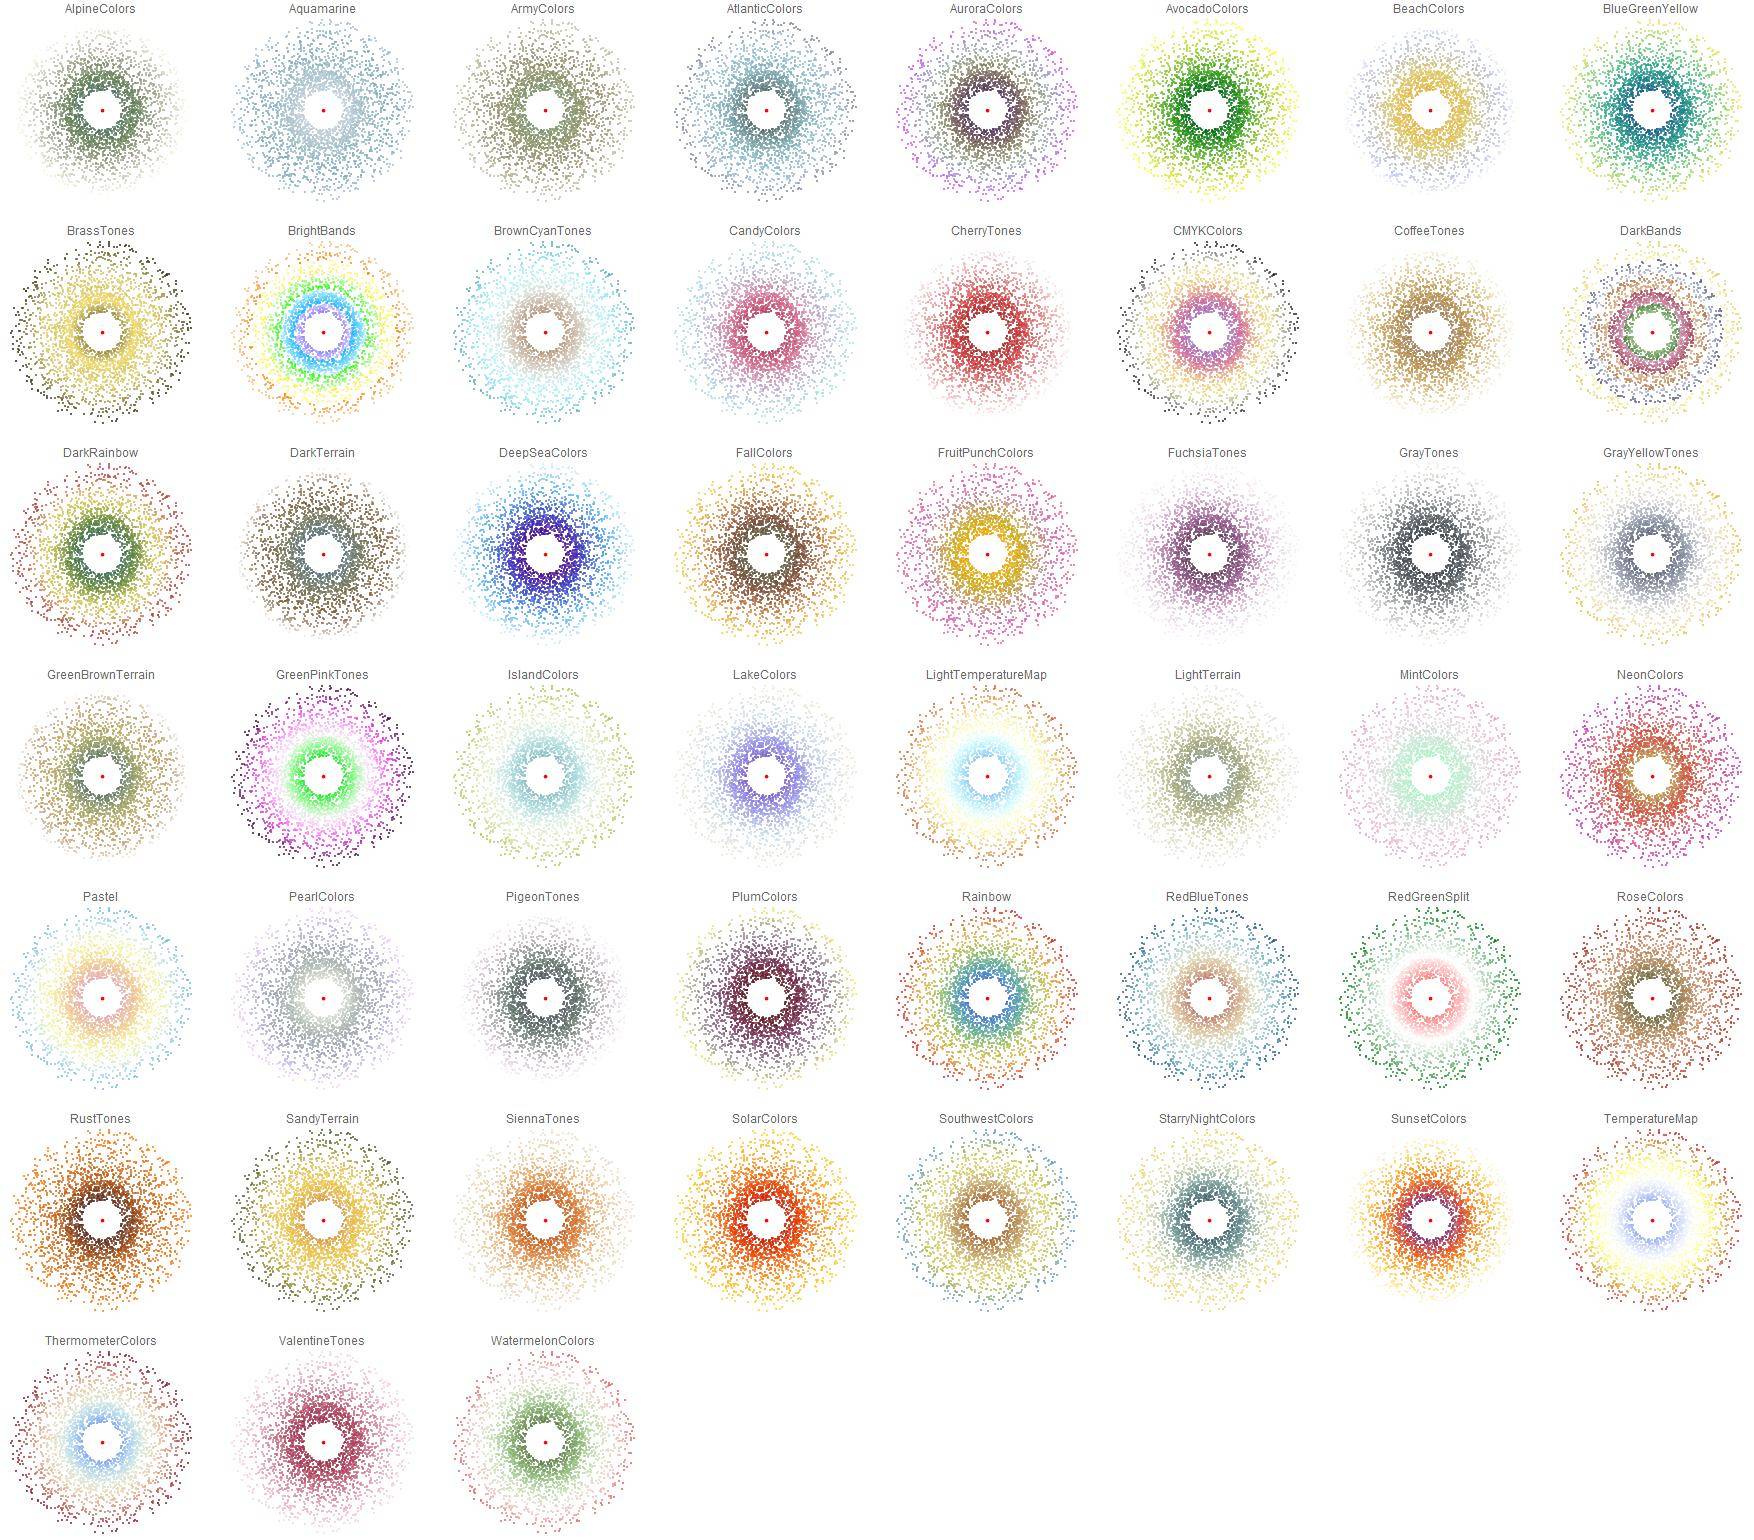
To choose which color you want I ran over all available and made the plot. You can choose the color name and replace it in the above code which uses "SolarColors".

enter image description here

$\endgroup$
1
  • $\begingroup$ Wow, you shorten my code so much with a very clever solution, exactly what I was looking for! $\endgroup$ Commented Aug 23, 2017 at 14:45
1
$\begingroup$
Graphics[
 {
  PointSize[Large],
  Red,
  Point[{0, 0}],
  PointSize[Medium],
  Table[
   {
    ColorData["Rainbow"][Rescale[r, {30, 0}]]
    , Point[
     CoordinateTransform[
      "Polar" -> "Cartesian", {r, RandomReal[{-π, π}]}]]
    }
   , {r, RandomVariate[GammaDistribution[10, 2], 3000]}
   ]
  }]

Mathematica graphics


For the legend

Grid@Table[
  {ColorData["Rainbow"][Rescale[r, {30, 0}]], r}, {r, 0, 30, 5}
  ]

Mathematica graphics


Code and plots done in Mathemathica 11.1.1 on Win7

$\endgroup$
2
  • $\begingroup$ This is a great solution, but I cannot control strips (I would need to because I need to change distribution as I want, and there's no pre written function which corresponds to all the combinantions I would like)... $\endgroup$ Commented Aug 23, 2017 at 14:27
  • $\begingroup$ @opisthofulax You can define your own distribution, instead of GammaDistribution, or use your own ser of points. I don't understand what you mean with "cannot control strips". $\endgroup$
    – rhermans
    Commented Aug 23, 2017 at 14:31

Your Answer

By clicking “Post Your Answer”, you agree to our terms of service and acknowledge you have read our privacy policy.

Not the answer you're looking for? Browse other questions tagged or ask your own question.