1
$\begingroup$

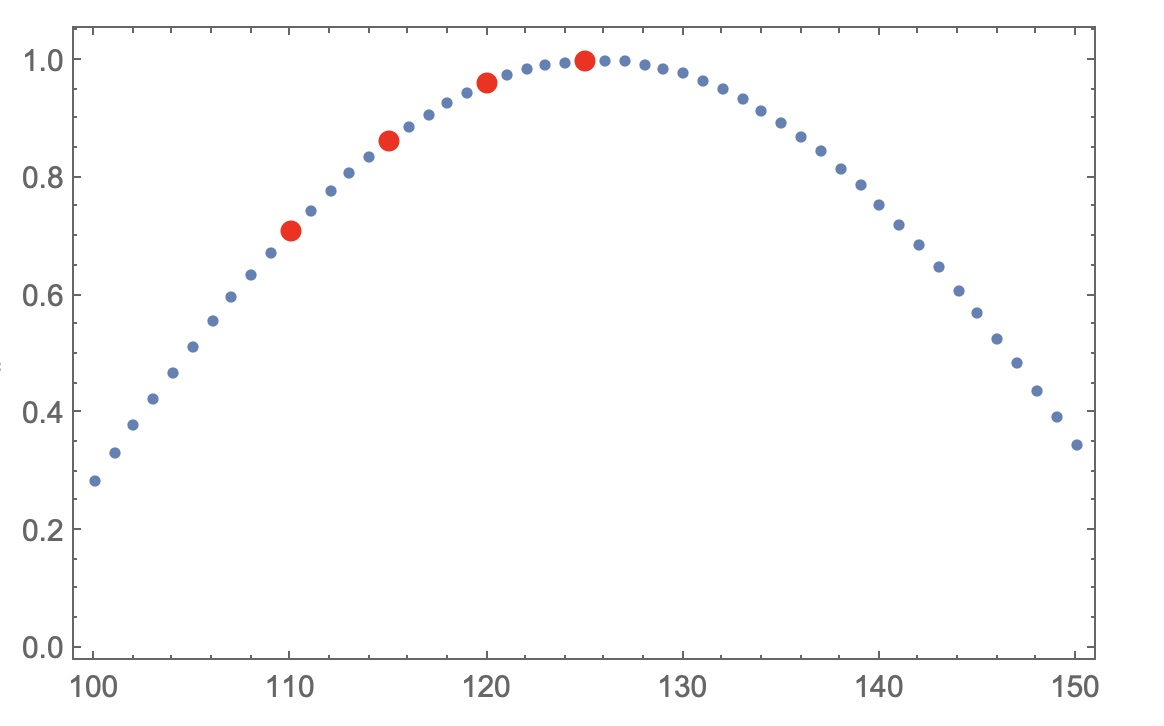
I've got two sets of points, plotted with ListPLot. I would like the second set to have one point of each color specified. I've tried using Directive but cannot seem to find the correct syntax.

A[q_] := Cos[q/20]; 

Show[ListPlot[Table[{q, A[q]}, {q, Range[100, 150]}]], 
     ListPlot[Table[{q, A[q]}, {q, Range[110, 125, 5]}], 
                PlotStyle -> {{PointSize[Large], Red},  
                              {PointSize[Large], Orange},      
                              {PointSize[Large], Blue},   
                              {PointSize[Large], Purple}}], 
                Frame -> True, Axes -> False]

enter image description here

$\endgroup$
5
  • $\begingroup$ ListPlot[List /@ Table[{q, A[q]}, {q, Range[110, 125, 5]}], PlotStyle -> {{PointSize[Large], Red}, {PointSize[Large], Orange}, {PointSize[Large], Blue}, {PointSize[Large], Purple}}] $\endgroup$
    – march
    Commented Jun 26, 2019 at 3:33
  • $\begingroup$ Thank you very much! I would like to understand this. List /@ maps List to each ordered pair, essentially making each pair of coordinates a list of a list? Why does this work? $\endgroup$
    – mjw
    Commented Jun 26, 2019 at 3:48
  • $\begingroup$ ListPlot accepts multiple sets of data as an argument, in the format of {list1, list2, list3, ...}. So I just made each point into a list of points (actually a list consisting of a single point) instead. That makes your syntax for PlotStyle work $\endgroup$
    – march
    Commented Jun 26, 2019 at 3:53
  • $\begingroup$ That's great! Thank you for the explanation! That also answers what would be my next question: "Why do we need to repeat PointSize[Large]?" Probably we can use Map again, or a similar construct. $\endgroup$
    – mjw
    Commented Jun 26, 2019 at 3:56
  • $\begingroup$ p[a_] := {PointSize[Large], a}; p /@ {Red, Orange, Blue, Purple} $\endgroup$
    – mjw
    Commented Jun 26, 2019 at 4:06

1 Answer 1

3
$\begingroup$

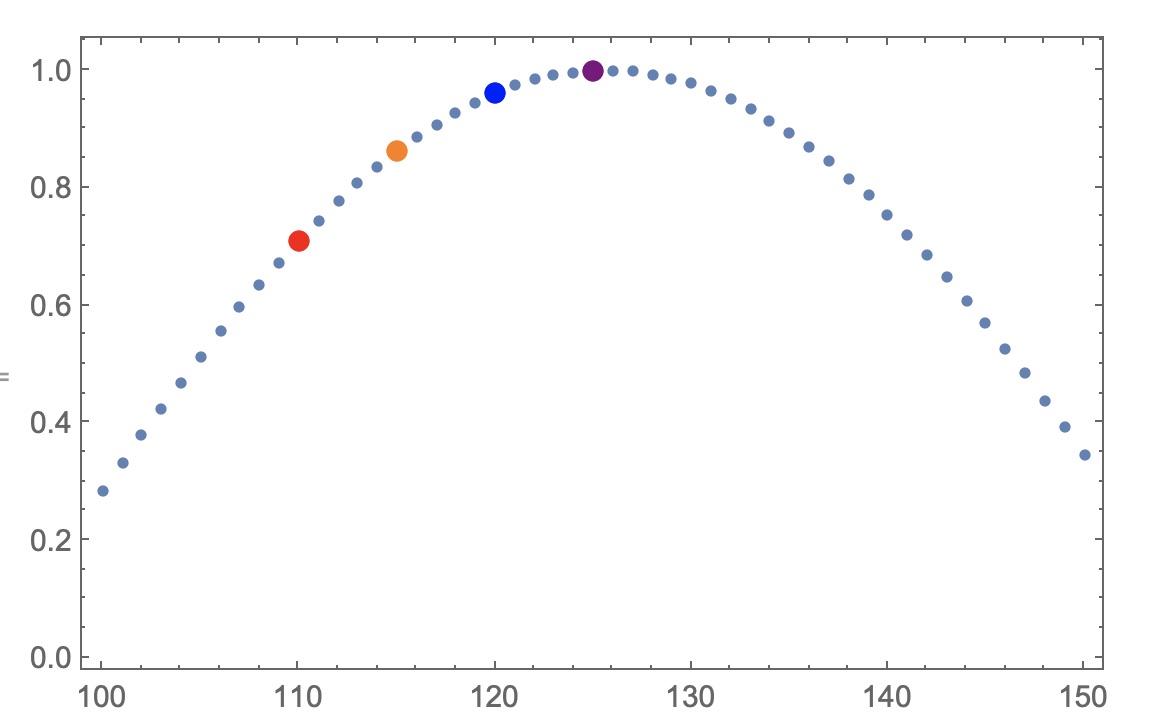
The question was answered in the comments! Here is the result:

A[q_] := Cos[q/20]; 

p[a_] := {PointSize[Large], a}; 

Show[ListPlot[Table[{q, A[q]}, {q, Range[100, 150]}]],  
      ListPlot[List /@ Table[{q, A[q]}, {q, Range[110, 125, 5]}], 
            PlotStyle -> p /@ {Red, Orange, Blue, Purple}], 
            Frame -> True, Axes -> False]

enter image description here

$\endgroup$

Your Answer

By clicking “Post Your Answer”, you agree to our terms of service and acknowledge you have read our privacy policy.

Not the answer you're looking for? Browse other questions tagged or ask your own question.