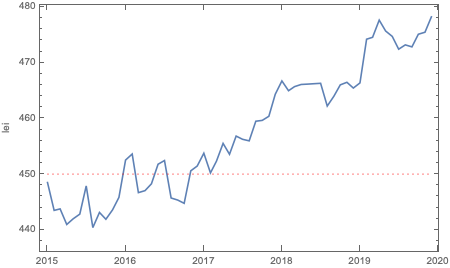
I would like to see the difference between 450 RON and 100EUR converted to RON on 1st of every month back to 4 years. possibly with a cumulated chart...
1 Answer
$\begingroup$
$\endgroup$
2
First we generate our dates:
dates = Flatten@
  Table[DateObject[{year, month, 1}], {year, 2015, 2019}, {month, 1, 12}]
then we can use CurrencyConvert:
values = Table[
  CurrencyConvert[Quantity[100, "Euros"], "RomanianLei", d], {d, dates}]
And now we can display it, for instance like this, drawing a line at 450 lei:
DateListPlot[Thread[{dates, values}], FrameLabel -> Automatic,
 Epilog :> {Dotted, Red, Line[{{{2015, 1, 1}, 450}, {{2019, 12, 1}, 450}}]}]
-
$\begingroup$ How can we get the total of the difference between 100 Eur in ROn and 450. Something like. values.map{|x|x-450}.sum (that was ruby, but you get the idea.)? $\endgroup$– BotiCommented Feb 26, 2020 at 14:22
-
$\begingroup$
Total[values - Quantity[450, "RomanianLei"]], which results inQuantity[469.35, "RomanianLei"]$\endgroup$ Commented Feb 26, 2020 at 14:40

