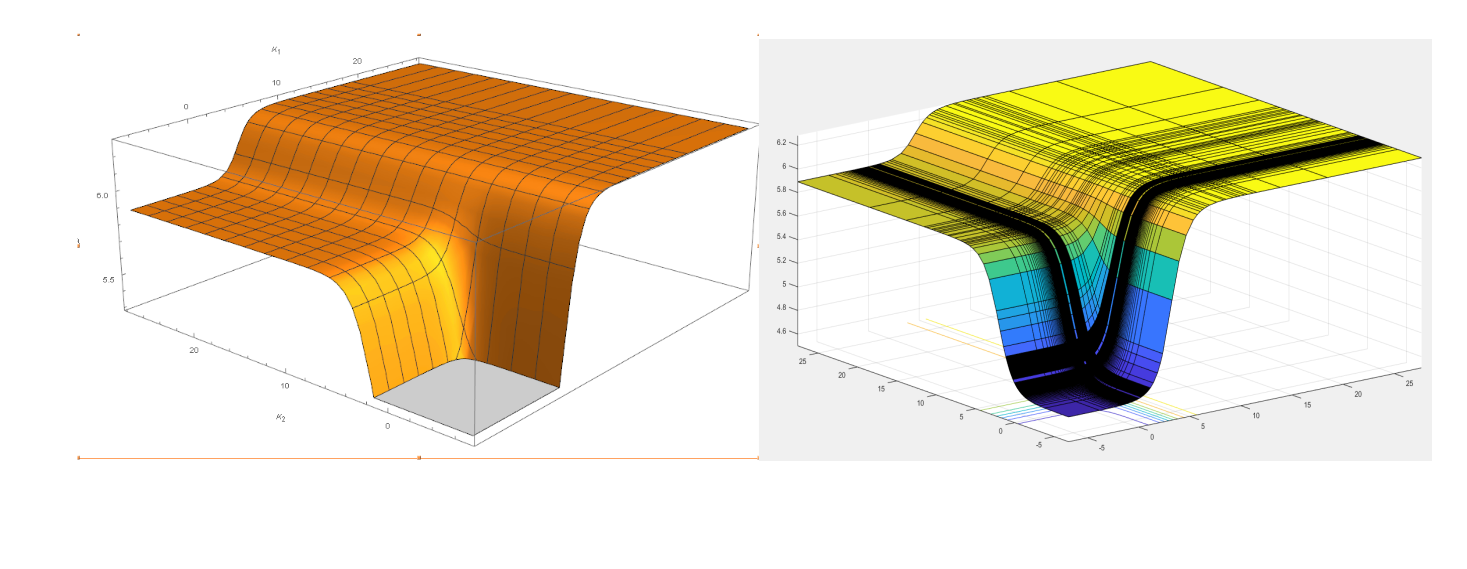
Why Mathematica surface plot is showing gray color in the lower region on the surface plot. But when I cross-checked with Matlab it is not showing any thing like that. I used ListPlot3D[data1,
AxesLabel -> {"k1","k2","L"}] function for plotting the surface plot in mathematica.
$\begingroup$
$\endgroup$
8


PlotRange -> Allto your plot command. $\endgroup$PlotRange -> AllorClippingStyle -> None. They give different results. You probably want the first. The second suggestion might help you understand what's going on. $\endgroup$PlotRangeorPlotRange->Allin Mathematica. The "L" axis in Mathematica only goes down to around 5.3 whereas the Matlab goes down much farther. The bigger question is what kind of color scheme does Matlab use? $\endgroup$