1
$\begingroup$

I have tried everything I think but I could not obtain a 3D contour plot from a list. Here is my code. Could you help me find the mistake I made?

data = 
  {{0., 0.0416667, 0.0103448, -22952.9}, {0., 0.0416667, .012069,-27172.}, 
   {0., 0.0416667, 0.0137931, -31593.6}, {0., 0.0416667,0.0155172, -36243.9}, 
   {0., 0.0416667, 0.0172414, -41149.6}, {0.,0.0416667,0.0189655, -46337.7}}

ListContourPlot3D[data] 

Unfortunately, the only thing I get is an empty box.

$\endgroup$
3
  • $\begingroup$ All the x, y, and function values are zero, so it's unclear what kind of output you expect. $\endgroup$
    – C. E.
    Commented Nov 2, 2019 at 22:22
  • $\begingroup$ Sorry @C.E, I have taken a part of my list to summarize my problem. Here, you could find the values of the fourth column which are not equal to zero. Thanks for your help. $\endgroup$
    – user45055
    Commented Nov 2, 2019 at 22:28
  • 1
    $\begingroup$ In the updated list, all of the x and y values are identical: 0., 0.0416667. $\endgroup$ Commented Nov 3, 2019 at 0:04

1 Answer 1

3
$\begingroup$
data = {{0., 0.0416667, 0.0103448, -22952.9}, {0., 0.0416667, 
    0.012069, -27172.}, {0., 0.0416667, 0.0137931, -31593.6}, {0., 0.0416667, 
    0.0155172, -36243.9}, {0., 0.0416667, 0.0172414, -41149.6}, {0., 
    0.0416667, 0.0189655, -46337.7}};

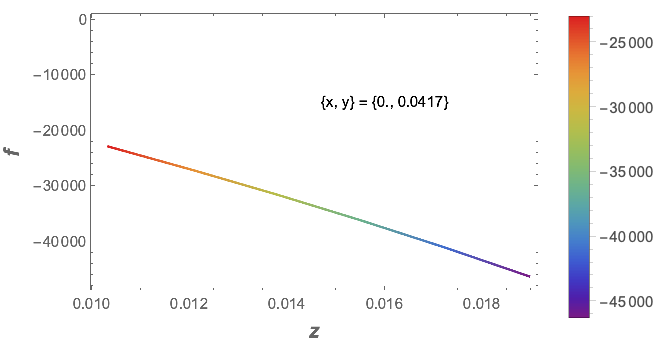
Since all of the x values are identical and all of the y values are identical, you can plot in 2D.

Legended[
 ListLinePlot[data[[All, 3 ;;]],
  Frame -> True,
  FrameLabel -> (Style[#, 14, Bold] & /@ {z, f}),
  ColorFunction -> "Rainbow",
  Epilog -> {Text[StringForm["{x, y} = ``",
      NumberForm[data[[1, {1, 2}]], 3]],
     {0.016, -15000}]}],
 BarLegend[{"Rainbow", MinMax@data[[All, 4]]}]]

enter image description here

$\endgroup$

Your Answer

By clicking “Post Your Answer”, you agree to our terms of service and acknowledge you have read our privacy policy.

Not the answer you're looking for? Browse other questions tagged or ask your own question.