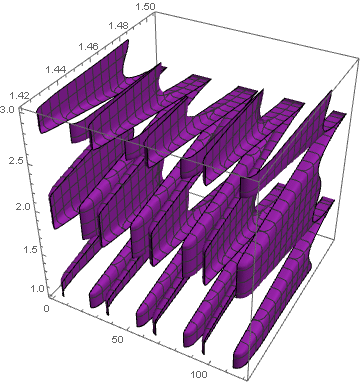
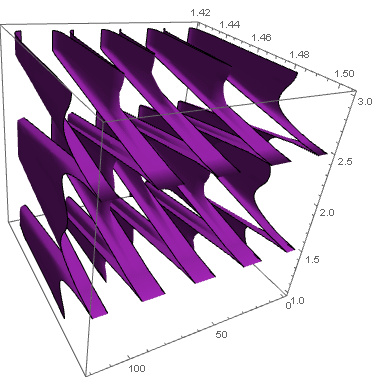
I want to do a ListContourPlot3D. The list of data is as follows
normplotP1={{0, 0, 2, 0.13188}, {0, 0, 3, 0.13188}, {30, 0, 1, 0.13188}, {30, 0,
  2, 0.13188}, {30, 0, 3, 0.13188}, {60, 0, 1, 0.13188}, {60, 0, 2,
  0.13188}, {60, 0, 3, 0.13188}, {90, 0, 1, 0.13188}, {90, 0, 2,
  0.13188}, {90, 0, 3, 0.13188}, {120, 0, 1, 0.13188}, {120, 0, 2,
  0.13188}, {120, 0, 3, 0.13188}, {0, 0.6, 1, 0.105504}, {0, 0.6, 2,
  0.105504}, {0, 0.6, 3, 0.105504}, {30, 0.6, 1, 0.105504}, {30, 0.6,
  2, 0.105504}, {30, 0.6, 3, 0.105504}, {60, 0.6, 1, 0.105504}, {60,
  0.6, 2, 0.105504}, {60, 0.6, 3, 0.105504}, {90, 0.6, 1,
  0.105504}, {90, 0.6, 2, 0.105504}, {90, 0.6, 3, 0.105504}, {120,
  0.6, 1, 0.105504}, {120, 0.6, 2, 0.105504}, {120, 0.6, 3,
  0.105504}, {0, 1.2, 1, 0.079128}, {0, 1.2, 2, 0.079128}, {0, 1.2, 3,
   0.079128}, {30, 1.2, 1, 0.079128}, {30, 1.2, 2, 0.079128}, {30,
  1.2, 3, 0.079128}, {60, 1.2, 1, 0.079128}, {60, 1.2, 2,
  0.079128}, {60, 1.2, 3, 0.079128}, {90, 1.2, 1, 0.079128}, {90, 1.2,
   2, 0.079128}, {90, 1.2, 3, 0.079128}, {120, 1.2, 1,
  0.079128}, {120, 1.2, 2, 0.079128}, {120, 1.2, 3, 0.079128}, {0,
  1.8, 1, 0.052752}, {0, 1.8, 2, 0.052752}, {0, 1.8, 3,
  0.052752}, {30, 1.8, 1, 0.052752}, {30, 1.8, 2, 0.052752}, {30, 1.8,
   3, 0.052752}, {60, 1.8, 1, 0.052752}, {60, 1.8, 2, 0.052752}, {60,
  1.8, 3, 0.052752}, {90, 1.8, 1, 0.052752}, {90, 1.8, 2,
  0.052752}, {90, 1.8, 3, 0.052752}, {120, 1.8, 1, 0.052752}, {120,
  1.8, 2, 0.052752}, {120, 1.8, 3, 0.052752}, {0, 2.4, 1,
  0.026376}, {0, 2.4, 2, 0.026376}, {0, 2.4, 3, 0.026376}, {30, 2.4,
  1, 0.026376}, {30, 2.4, 2, 0.026376}, {30, 2.4, 3, 0.026376}, {60,
  2.4, 1, 0.026376}, {60, 2.4, 2, 0.026376}, {60, 2.4, 3,
  0.026376}, {90, 2.4, 1, 0.026376}, {90, 2.4, 2, 0.026376}, {90, 2.4,
   3, 0.026376}, {120, 2.4, 1, 0.026376}, {120, 2.4, 2,
  0.026376}, {120, 2.4, 3, 0.026376}, {0, 2.9, 1, 0.004396}, {0, 2.9,
  2, 0.004396}, {0, 2.9, 3, 0.004396}, {30, 2.9, 1, 0.004396}, {30,
  2.9, 2, 0.004396}, {30, 2.9, 3, 0.004396}, {60, 2.9, 1,
  0.004396}, {60, 2.9, 2, 0.004396}, {60, 2.9, 3, 0.004396}, {90, 2.9,
   1, 0.004396}, {90, 2.9, 2, 0.004396}, {90, 2.9, 3, 0.004396}, {120,
   2.9, 1, 0.004396}, {120, 2.9, 2, 0.004396}, {120, 2.9, 3,
  0.004396}, {0, 0, 1, 0.13188}}
Now if I try and solve
ListContourPlot3D[normplotP1, Contours -> 1
 , ColorFunction -> "Rainbow"]
I get a blank contour plot. What is the correct way to plot this data?


ListContourPlot3Dis means for 3d data, and your matrix is 90 by 4. You could always useMatrixPlot[normplotP1, AspectRatio -> 1]to get a matrix view of the data. $\endgroup$ListContourPlot3Din the docs is of the form{x, y, z, f}, precisely as OP has given. It should work. $\endgroup$