I have the following function:
\[Phi]re[{x_, y_}] := With[{z = x + I y}, -Re[
z - 1 - ProductLog[Ceiling[(y - \[Pi])/(2 \[Pi])], Exp[z - 1]]]]
Also I have calculated the following Contours list to it:
cont={6.00247, 5.759, 5.51552, 5.27204, 5.02857, 4.78509, 4.54161, \
4.29814, 4.05466, 3.81118, 3.56771, 3.32423, 3.08075, 2.83728, \
2.5938, 2.35032, 2.10685, 1.86337, 1.61989, 1.37642, 1.18064, \
0.937161, 0.693684, 0.450208, 0.206731, -0.0367459, -0.280223, \
-0.523699, -0.767176, -1.01065, -1.25413, -1.49761, -1.74108, \
-1.98456, -2.22804, -2.47151, -2.71499}
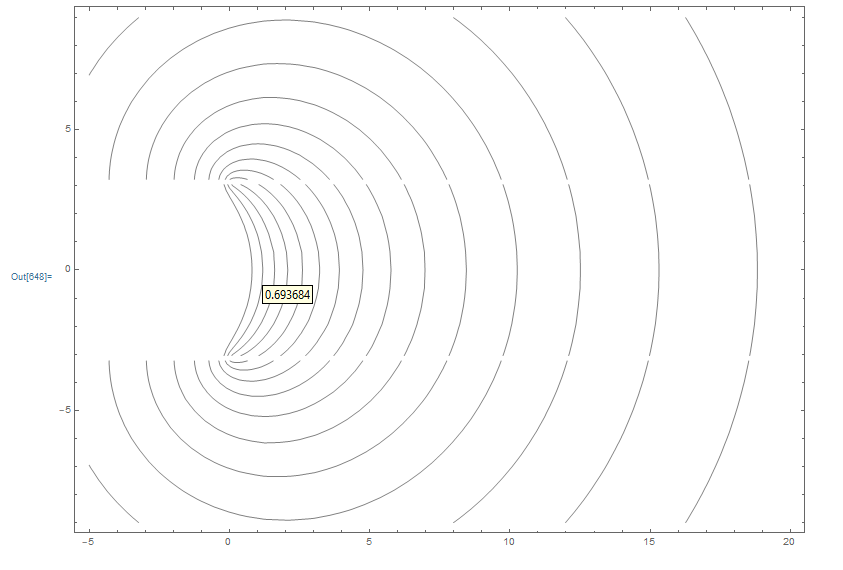
Now if I use ContourPlot, the highest value, that is still plotted is dependent of the overall PlotRanges, as you can see here with the following plot the maximum contour line is at ~0.69:
contplot = ContourPlot[\[Phi]re[{x, z}], {x, -5, 20}, {z, -9, 9},
  ContourShading -> False, Contours -> cont, AspectRatio -> Automatic]
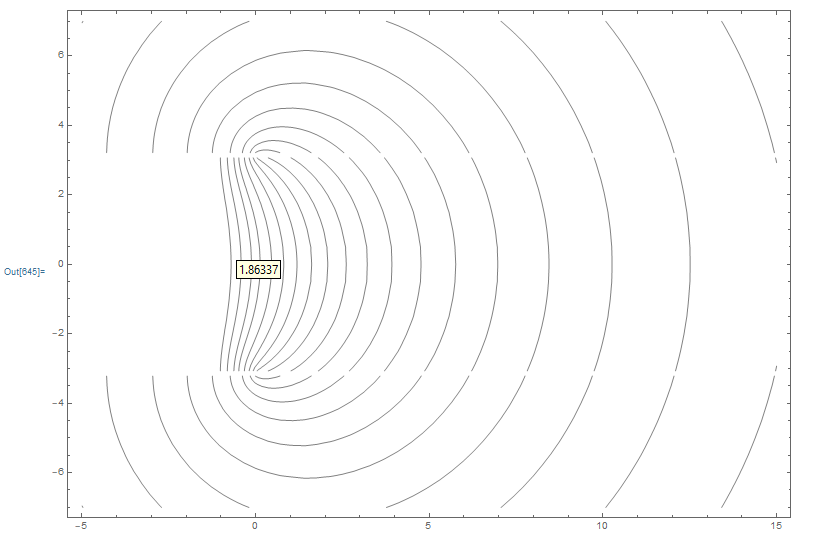
in the next case I have a maximum contour line of ~1.86:
contplot = ContourPlot[\[Phi]re[{x, z}], {x, -5, 15}, {z, -7, 7},
ContourShading -> False, Contours -> cont, AspectRatio -> Automatic]
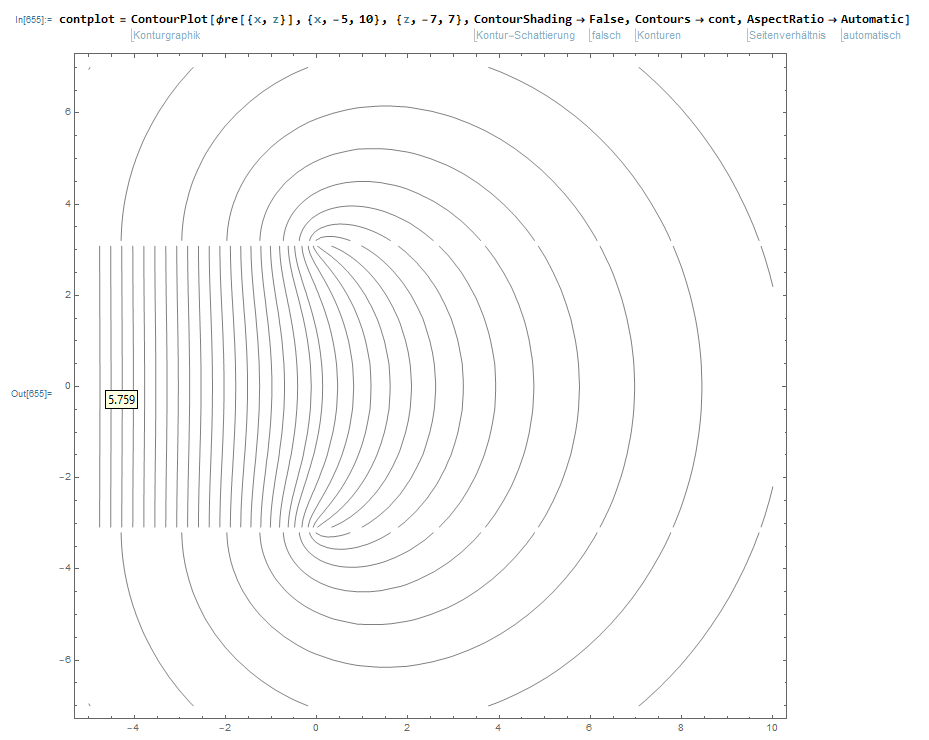
and finally in the third case, with the smallest PlotRange I have all contours of my contours list plotted with:
Why are the amount of Contour Lines depending of the overall PlotRange, even if I have a well defined List of desired Contour-Values?
And furthermore how can I bypass this behavior, to get all Contour Values possible of my Contour List?


