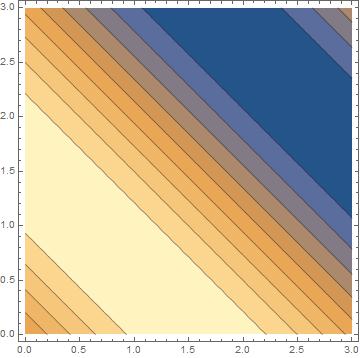
This is probably very simple. I want to do a simple ListContourPlot.
contourData = Table[ myFunc[x,y], {x,0.1, 2.9}, {y,0.1, 2.9}];
ListContourPlot[contourData]
This works without a problem.
Now, I want to include x and y values so that I can show the values corresponding to specific values of x and y. I modify the Table statement to include x and y values.
contourData = Table[ {x,y, myFunc[x,y]}, {x,0.1, 2.9}, {y,0.1, 2.9}];
ListContourPlot[contourData]
My contour plot is now blank. I'm guessing it is a problem with the Table statement. The maximum minus minimum over this range is about 220. As this is a function of Pythagorean distance, the values vary (so I don't think it is a case of essentially equal values over the ranges of x and y.
What is the correct way to generate data for a ListContourPlot?


ListContourPlot[Flatten[contourData, 1]]. $\endgroup$