How to construct a contour plot so that positive contour lines are colored red and negative contour lines are colored blue. I tried using functions to set the color, but I always got lines colored the same color. Thank you in advance
colorData = data[[All, 6]];
colorFunction[colorData_] := If[colorData > 0, Green, Blue];
f = ColorData["AvocadoColors"];

lapPlot =
 ListContourPlot[lapPlane[[All, {4, 5, 6}]], PlotLegends -> Automatic,
   Contours -> 100, ContourShading -> None,
  ContourLabels -> Automatic,
  ContourStyle -> f /@ Rescale[colorData]]
Unfortunately, due to the large size, I am unable to load all the input data. input data enter link description here

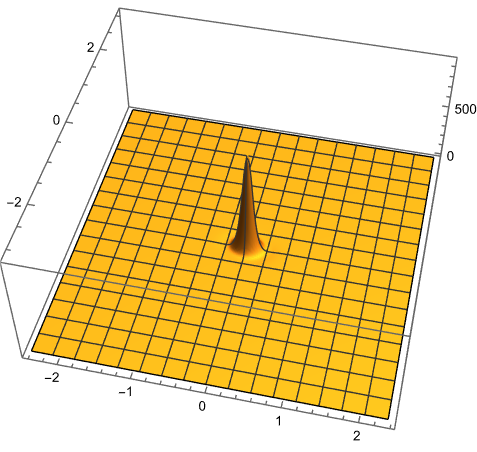



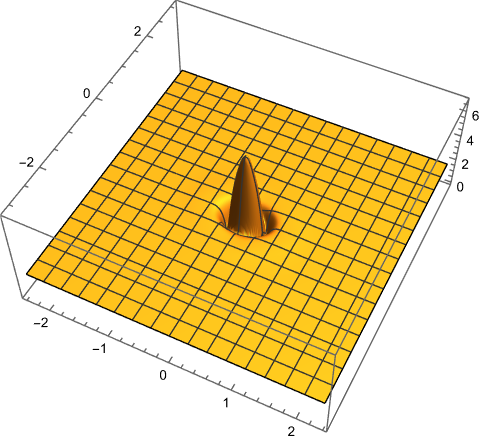






Show[ContourPlot[for negatives in blue], Contourplot[for positives in red]]$\endgroup$ContourPlot[Sin[x + y], {x, -Pi, Pi}, {y, -Pi, Pi}, ColorFunction -> Function[{x, y}, If[TrueQ[Sin[x*y] >= 0], Blue, Red]], PlotPoints -> 50 ]is not true. $\endgroup$