0
$\begingroup$

When I try to plot the DSolve output, I get empty plot.

Here is the code

Eq1 = -(r + k)/k*(1 + 1/beta)*D[(D[u[r], r] - (u[r] + 1)/(r + k)), r] == p
bcs1 =  u[-1] == 1;
bcs2 = u[1] == 1;
sol = DSolve[{Eq1, bcs1, bcs2}, u[r], r]
k = 0.1; beta = 0.1; p = 0.1;
Plot[u[r] /. sol, {r, -1, 1}]

I have no idea where, I made a mistake.

Please guide me.

Thanks

$\endgroup$
1
  • 2
    $\begingroup$ When something won't plot, it's useful to look at the numerical values. ThingThatWontPlot/.variable->SomeSensibleValue//N $\endgroup$
    – John Doty
    Commented Jun 9, 2015 at 16:20

1 Answer 1

5
$\begingroup$

One way to see the problem, is to evaluate the solution, using Table for some values:

 Chop@Table[u[r] /. sol, {r, -1, 1, .1}]

Mathematica graphics

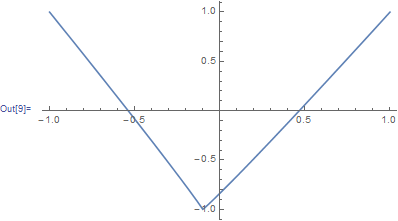
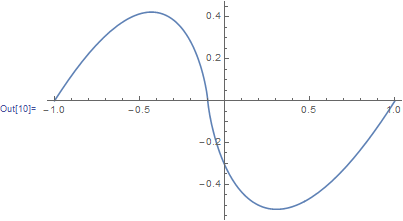
So the solution is complex valued. So to plot it, use Re and Im

 Plot[Re[u[r] /. sol], {r, -1, 1}]

Mathematica graphics

 Plot[Im[u[r] /. sol], {r, -1, 1}]

Mathematica graphics

$\endgroup$

Your Answer

By clicking “Post Your Answer”, you agree to our terms of service and acknowledge you have read our privacy policy.

Not the answer you're looking for? Browse other questions tagged or ask your own question.