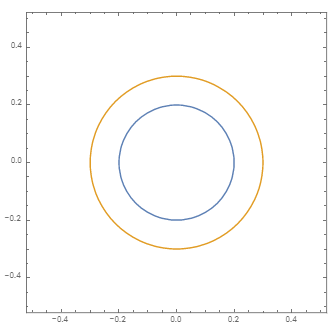
The first command below produces proper contour lines while the second command produces an empty plot. I would think that the two commands should produce the same output. What's going on?
ContourPlot[{x^2 + y^2 == .04, x^2 + y^2 == .09}, {x, -.5, .5}, {y, -.5, .5}]
ContourPlot[Table[x^2 + y^2 == k, {k, {.04, .09}}], {x, -.5, .5}, {y, -.5, .5}]


ContourPlot[ Evaluate@Table[ x^2 + y^2 == k, {k, {.04, .09}}], {x, -.5, .5}, {y, -.5, .5}]? $\endgroup$