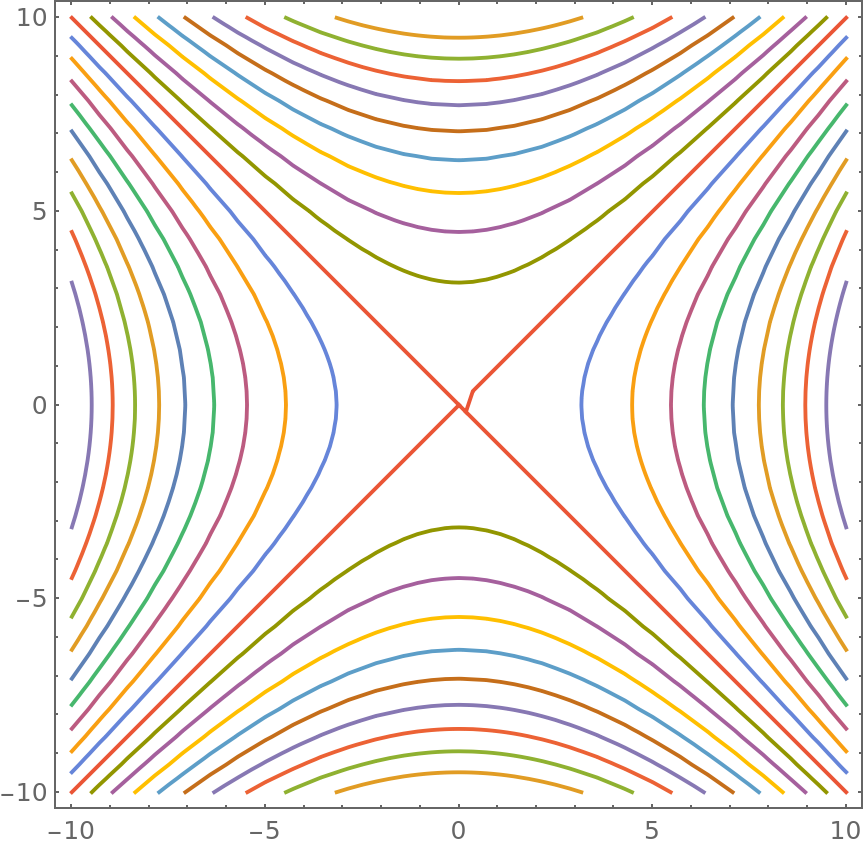
I'm trying to make a contour plot for multiple values of the same function.
To accomplish that, I'm doing the following:
lst = Table[x^2 - y^2 == i, {i, -100, 100, 10} ]

ContourPlot[lst, {x,-10,10}, {y,-10,10}]
But it produces an empty plot (it's blank).
However, if I paste the contents of the list into the command, i.e.,
ContourPlot[
 {x^2 - y^2 == -100, x^2 - y^2 == -90, x^2 - y^2 == -80,
 x^2 - y^2 == -70, x^2 - y^2 == -60, x^2 - y^2 == -50,
 x^2 - y^2 == -40, x^2 - y^2 == -30, x^2 - y^2 == -20,
 x^2 - y^2 == -10, x^2 - y^2 == 0, x^2 - y^2 == 10, x^2 - y^2 == 20,
 x^2 - y^2 == 30, x^2 - y^2 == 40, x^2 - y^2 == 50, x^2 - y^2 == 60,
 x^2 - y^2 == 70, x^2 - y^2 == 80, x^2 - y^2 == 90, x^2 - y^2 == 100},
 {x, -10, 10}, {y, -10, 10}]
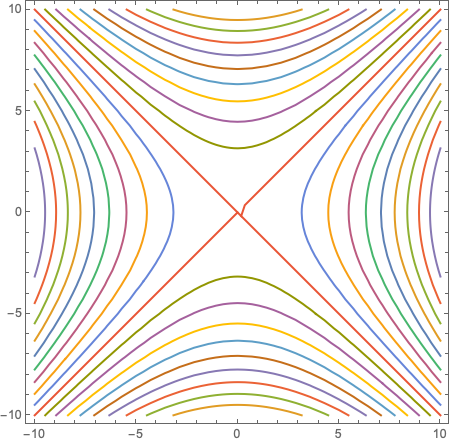
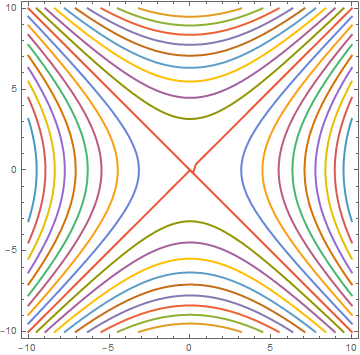
it works.
What's is the difference between using lst, instead of the whole list within ContourPlot[].


ContourPlot[x^2 - y^2, {x, -10, 10}, {y, -10, 10}, Contours -> Range[-100, 100, 10], ContourShading -> None]. $\endgroup$