3
$\begingroup$

I'm plotting two functions in Mathematica:

pp = 100;

z = x + I y;
w[z_] := z + 1/z;

Plot3D[{Re[w[z]], Im[w[z]]}, 
 {x, -1, 1}, {y, -1, 1}, 
 MeshFunctions -> {#3 &},
 MeshStyle -> {Blue, Red}, 
 BoxRatios -> {1, 1, 1},
 PlotStyle -> Opacity[0.5], 
 PlotPoints -> pp, 
 ImageSize -> Large
 ]

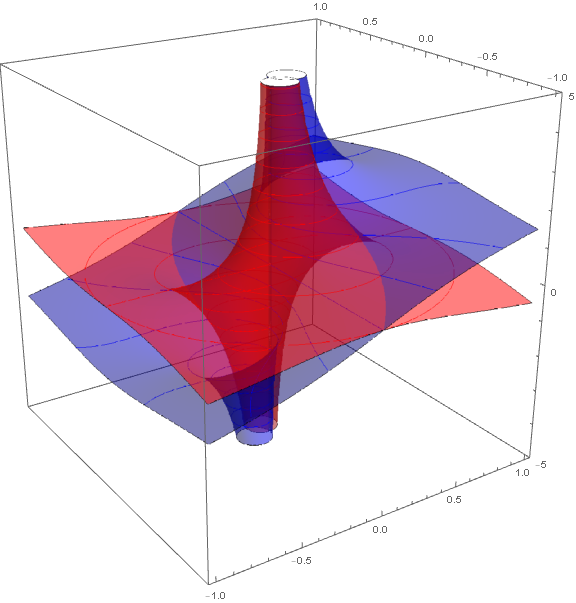
I would like to have two different mesh line color, one for every function, so that every function has his own contour lines distinguished from the other's. So, for example, my plot is:

enter image description here

while I would like that the blue surface to have red contour lines. I would also prefer not to have the two plot separated with the Show function, if it is possible I would like to make the whole plot in the same command Plot3D[...].

EDIT:

At the same time it would be nice also to know how to change the color of the two surfaces, still inside the Plot3D[...].

$\endgroup$

1 Answer 1

4
$\begingroup$

With a bit of functional programming you can write only one Plot3D function and map it over the parameters. Read the Pure Functions tutorial and Related Tutorials found there.

With pp, z, and w as defined then OP.

Plot3D[#1[w[z]], {x, -1, 1}, {y, -1, 1},
    MeshFunctions -> {#3 &},
    MeshStyle -> #2,
    PlotRange -> {-5, 5},
    PlotStyle -> Opacity[.5, #2],
    BoxRatios -> {1, 1, 1},
    PlotStyle -> Opacity[0.5],
    PlotPoints -> pp,
    ImageSize -> Large] & @@@ {{Re, Blue}, {Im, Red}} // Show

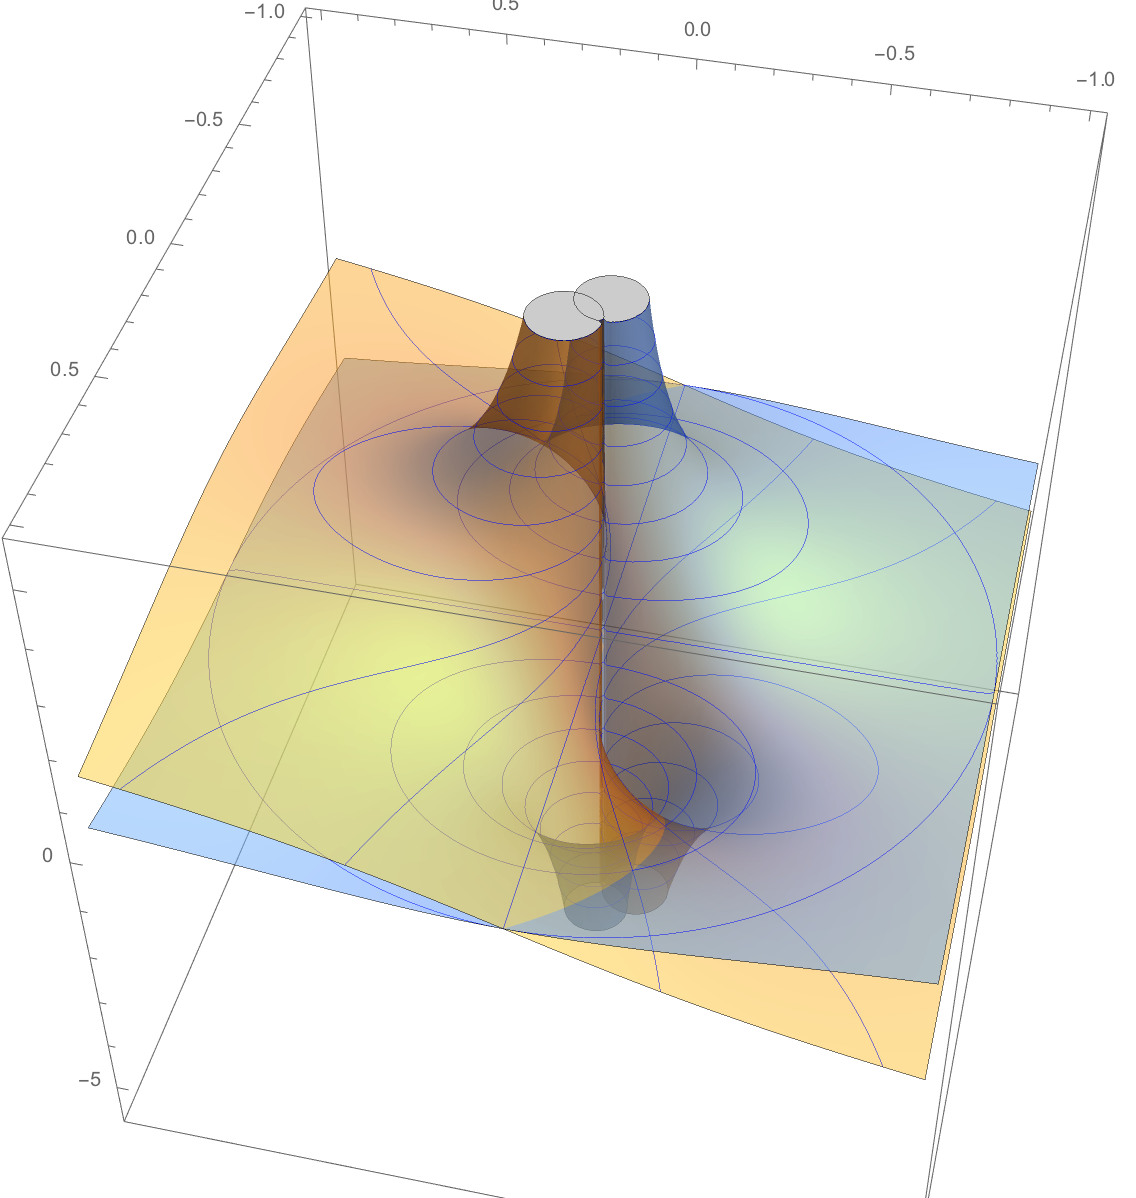
Mathematica graphics

Hope this helps.

$\endgroup$

Your Answer

By clicking “Post Your Answer”, you agree to our terms of service and acknowledge you have read our privacy policy.

Not the answer you're looking for? Browse other questions tagged or ask your own question.