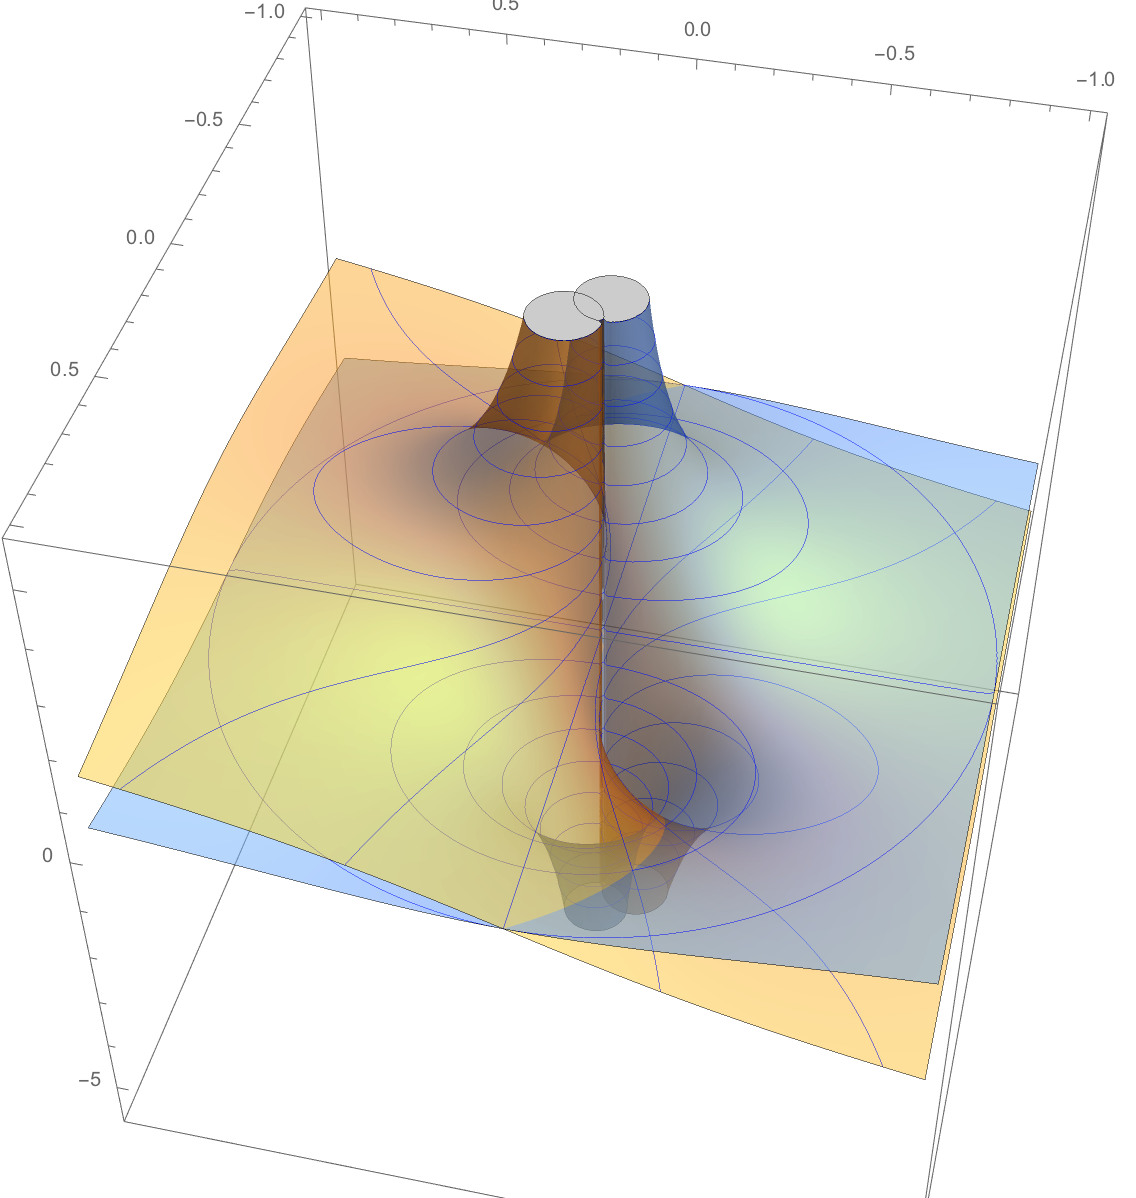
I'm plotting two functions in Mathematica:
pp = 100;

z = x + I y;
w[z_] := z + 1/z;

Plot3D[{Re[w[z]], Im[w[z]]},
 {x, -1, 1}, {y, -1, 1},
 MeshFunctions -> {#3 &},
 MeshStyle -> {Blue, Red},
 BoxRatios -> {1, 1, 1},
 PlotStyle -> Opacity[0.5],
 PlotPoints -> pp,
 ImageSize -> Large
 ]
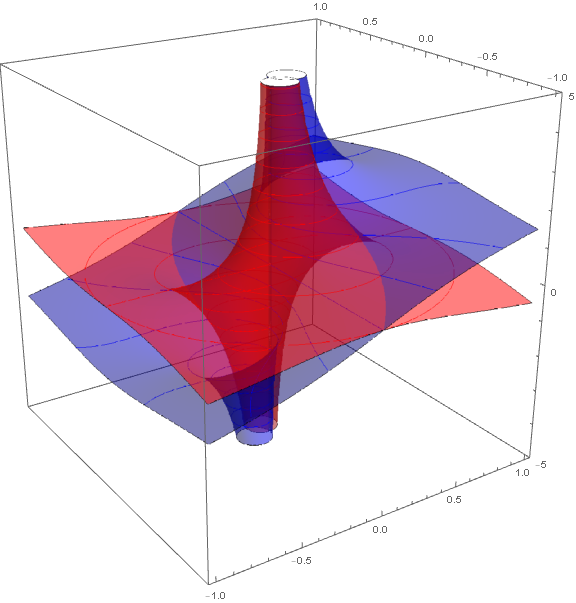
I would like to have two different mesh line color, one for every function, so that every function has his own contour lines distinguished from the other's. So, for example, my plot is:
while I would like that the blue surface to have red contour lines. I would also prefer not to have the two plot separated with the Show function, if it is possible I would like to make the whole plot in the same command Plot3D[...].
EDIT:
At the same time it would be nice also to know how to change the color of the two surfaces, still inside the Plot3D[...].


