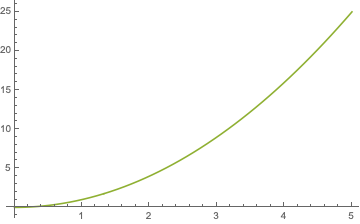
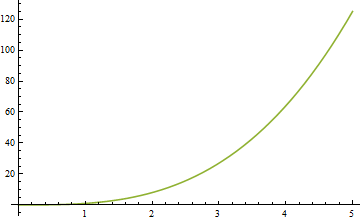
This question (at least for v10) seems to have been asked many times, but I cannot decipher the answers. I have read a few posts about this - but I don't know how to use any of the answers (e.g. How to access new colour schemes in version 10?,What are the standard colors for plots in Mathematica 10? [duplicate], What's the default colormap (or color scheme) used in mathematica?).
Can anyone provide some basic example code that would let you plot using say the third default colour?
e.g. if I wanted to replicate only the cubic curve in the first plot, but keep the same colouring for this line between my two plots how would I fix my code?
Plot[{x,x^2,x^3},{x,0,5}]

Plot[{x^3},{x,0,5},PlotStyle->DefaultLineColour3]
what do you replace DefaultLineColour3 with?
I'm hoping there's a way to access the Default Colours rather than get the rgb commands, and then define my own colour commands at the start of the notebook to cycle through this list, and then use this - but I'm not sure this is possible. Probably obvious - but it's not specifically the 3rd line colour I'm interested in that is just an example (so giving me the RGB code for that colour isn't what I am looking for).
Please don't just mark this as a duplicate - I know the question has been asked before it's just that the answers aren't at all helpful for a basic user.


