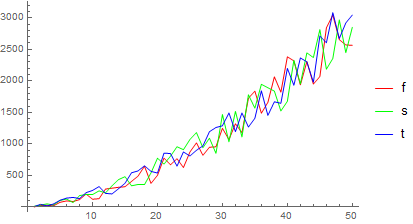
I'm trying to format a csv file to give a plot with x and y coordinates, but colour coded by a third value that is a string. I have no issue reading the data in and can plot the x and y coordinates. But I am a little stuck on how to colour code the plot from the strings.
E.g. of the data [2.3, 3.4, phot, 4.1, 5.2, compt]
So far I've read the data in and plotted it. My code so far is: AlNP20 = Import["file.csv", {"Data", 1 ;; 271, {1, 2}}];
AlNPProcess20 = Import["file.csv", {"Data", 1 ;; 271, {11}}];
ListPlot[AlNP20]
This gives me the plot of x and y, but any help on how to incorporate the strings as colour coding would be greatly appreciated!


