0
$\begingroup$

I have a CSV data file with X position, Y position and corresponding intensity as Z.

I would like to plot it to form an image. I have an idea that list density plot is one method,but, somehow the importing of the CSV file as table and plotting is resulting in an error :

Read::readn: "Invalid real number found when reading from "test2 10 10.csv."

I am totally new to Mathematica and just learning. I don't understand why it takes so long to even import a CSV file.

Thanks !

$\endgroup$
3
  • 3
    $\begingroup$ It may help to get a good answer if you post your code and some example data. I'm sure you'll have a solution in no time at all then $\endgroup$ Commented May 6, 2012 at 10:41
  • 9
    $\begingroup$ Please try to isolate the specific issue that's causing problems, and post a minimal working examples (i.e. the smallest code snippet and input file that reproduces the problem). It seems that you are having trouble importing from CSV---this is a separate problem from plotting. We can't find out what goes wrong with the CSV import without seeing a sample data file (please try to create the smallest possible CSV that reproduces the problem, preferably just a few lines, and post it together with the code you used for importing) $\endgroup$
    – Szabolcs
    Commented May 6, 2012 at 10:56
  • 4
    $\begingroup$ Did you try Import? $\endgroup$ Commented May 6, 2012 at 13:56

2 Answers 2

7
$\begingroup$
(*Testing ...
First we generate some points*)
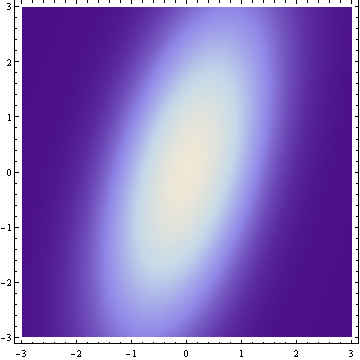
points = Flatten[Table[{x, y, PDF[BinormalDistribution[{0, 0}, {1, 2}, .5], {x, y}]}, 
                       {x, -3, 3, .1}, {y, -3, 3, .1}], 1];
(*
Now we export it as a csv
*)
Export["c:\\points.csv", points];

(* The file looks like this:
-3.,-3.,0.0010207851317789406
-3.,-2.9,0.0010190852401957891
-3.,-2.8,0.0010140025313558822
-3.,-2.7,0.0010055876210847213
-3.,-2.6,0.0009939239359647277
...
*)
(* Finally import it and plot*)

ListDensityPlot[Import["c:\\points.csv"]]

enter image description here

Edit

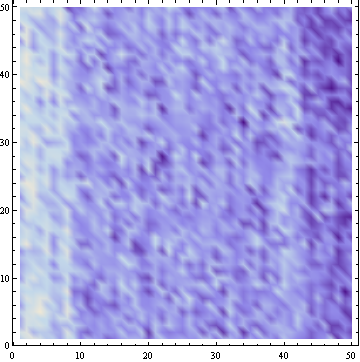
I had no problems at all downloading your sample file and plotting it:

enter image description here

$\endgroup$
2
2
$\begingroup$

Looking at the sample file, it seems that your data may be on a regular grid:

data = Import["wafer test 5-8-12 test5.csv"];

data = GatherBy[data, First];

Equal @@ dd[[All, All, 2]]

(*
==> True
*)

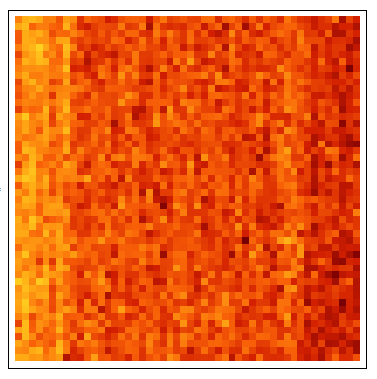
which means that we could also use ArrayPlot, if you want a more 'discrete' appearance:

ArrayPlot[Transpose[dd[[All, All, 3]]], ColorFunction -> "SolarColors"]

enter image description here

I had to transpose my data since I gathered by the x values, so each row of data ends up being constant x instead of y. Also you might want to use the DataReversed option for ArrayPlot, since ArrayPlot and ListDensityPlot treat arrays slightly differently.

$\endgroup$

Your Answer

By clicking “Post Your Answer”, you agree to our terms of service and acknowledge you have read our privacy policy.

Not the answer you're looking for? Browse other questions tagged or ask your own question.