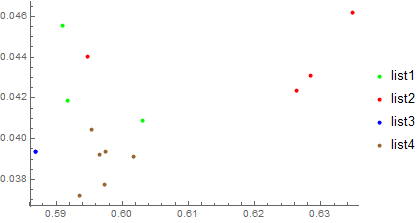
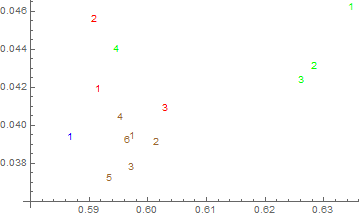
My apologies if this has been asked before. I want to plot 4 different lists on a ListPlot with different colors. Also, the points plotted should be the position they occupy within their respective list.
Sample data and my plot code:
list1= {{0.591653, 0.0418934}, {0.591035, 0.0455681}, {0.603025, 0.0408828}};
list2= {{0.634767, 0.0461997}, {0.628494, 0.0431151}, {0.626289, 0.0423427}, {0.594795, 0.0440121}};
list3= {{0.586881, 0.0393839}};
list4= {{0.597532, 0.0393935}, {0.60162, 0.0391133}, {0.597306, 0.0377564}, {0.595407, 0.040435}, {0.593592, 0.0371951}, {0.596557, 0.0392133}};

ListPlot[{list1, list2, list3, list4}, PlotStyle -> {Green, Red, Blue,Brown}, PlotLegends -> {"list1", "list2", "list3", "list4"}]
From what I have done so far I get the points plotted from these lists as different colors. But I want the individual points to be represented as the number which they occupy within their list. So points points of list1 will be of same color(eg. green) going from 1 to 3, points of list2 of same color(eg. red) going from 1 to 4 and so on.


