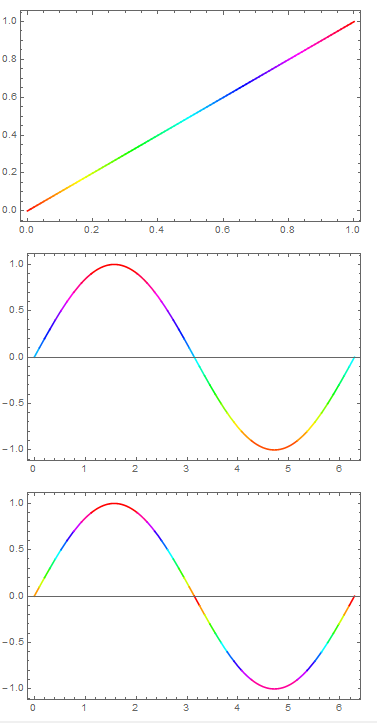
You could also use MeshShading, e.g.
Plot[x, {x, 0, 1}, Mesh -> {Range[0, 1, 0.01]},
 MeshShading -> Hue /@ Range[0, 1, 0.01], MeshStyle -> None,
 Frame -> True]
Plot[Sin[x], {x, 0, 2 Pi}, Mesh -> {Range[-1, 1, 0.1]},
 MeshFunctions -> (#2 &),
 MeshShading -> (Hue[Rescale[#, {-1, 1}]] & /@ Range[-1, 1, 0.1]),
 MeshStyle -> None, Frame -> True]
Plot[Sin[x], {x, 0, 2 Pi}, MeshFunctions -> (#2 &),
 Mesh -> {Range[-1, 1, 0.1]},
 MeshShading -> (Hue[Abs@#] & /@ Range[-1, 1, 0.1]),
 MeshStyle -> None, Frame -> True]
(in first plot domain and range same so did not needMeshFunctions)
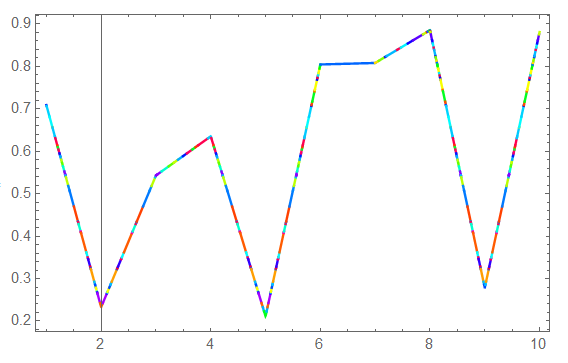
Illustrating arbitrary list of points (and line segments) and color function based on third variable:
dat = Table[{j, RandomReal[], RandomReal[{0, 10}]}, {j, 100}];
if = Interpolation[dat[[All, {1, 2}]], InterpolationOrder -> 1];
Plot[if[x], {x, 1, 10}, MeshFunctions -> (#2 &),
 Mesh -> {dat[[All, 2]]},
 MeshShading -> (Hue[Rescale[#, {0, 10}]] & /@ dat[[All, 3]]),
 MeshStyle -> None, Frame -> True]

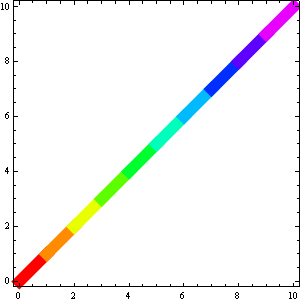
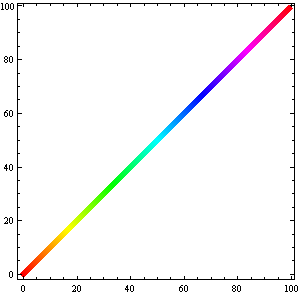
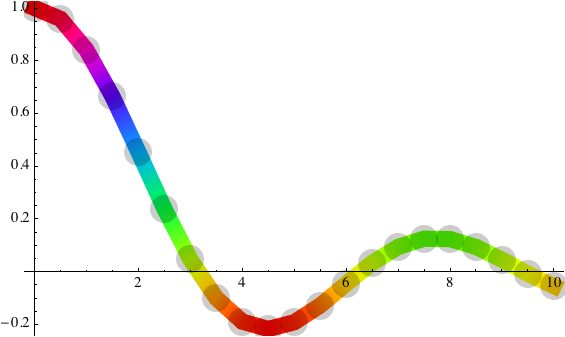


{Hue[#1[[ 3]]/Length[T]], Line[{##}[[ ;; , ;; 2]]]} & @@@ Partition[T, 2, 1],$\endgroup$