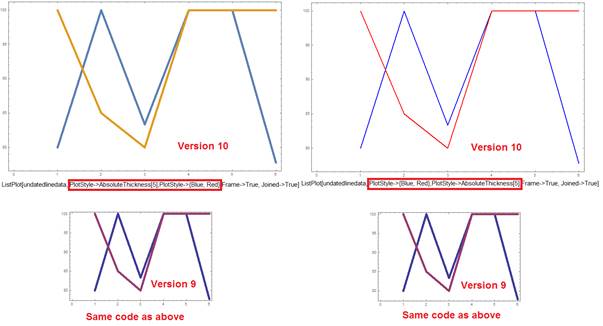
In Mathematica v9, I was able to append / apply PlotStyle option to an existing ListPlot graph and get updated styles, such as ListPlot[undatedlinedata,PlotStyle→{Blue,Red},PlotStyle→AbsoluteThickness[5],Frame→True,Joined→True].
But in Mathematica v11, any subsequent PlotStyle option is ignored, see screenshot below for the end results of the same command in two versions.
I understand I can use a list of Directive to update the PlotStyle, such as ListPlot[undatedlinedata,PlotStyle->{Directive[Red, AbsoluteThickness[5]],
Directive[Blue, AbsoluteThickness[5]]}, Joined->True]. But things would get messy when line data is huge and there are plenty of PlotStyles already applied to the existing plot, such as default options.
Is there an easier way to append / add PlotStyle to ListPlot in Mathematica v11?

