3
$\begingroup$

I know only three plot style

m = 1;
w = 1;
U = m*w^2 z^2/2;
p1 = Plot[U, {z, -1, 1}, PlotStyle -> Dashed]
p2 = Plot[U/2, {z, -1, 1}, PlotStyle -> Dotted]
p3 = Plot[U/3, {z, -1, 1}, PlotStyle -> DotDashed]
Show[p1, p2, p3] ![Superimposed, p1, p2, p3][2]  

as shown. How to get more options for line style as I need to show more plots and I also need to show the legends to specify which plot is corresponding to what.
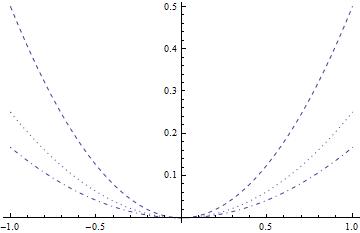
superimposed p1, p2 , p3

$\endgroup$
0

1 Answer 1

8
$\begingroup$

You can read the documentation of PlotStyle under Details.

Using Thickness, Dashing and RGBColor or Hue may help.

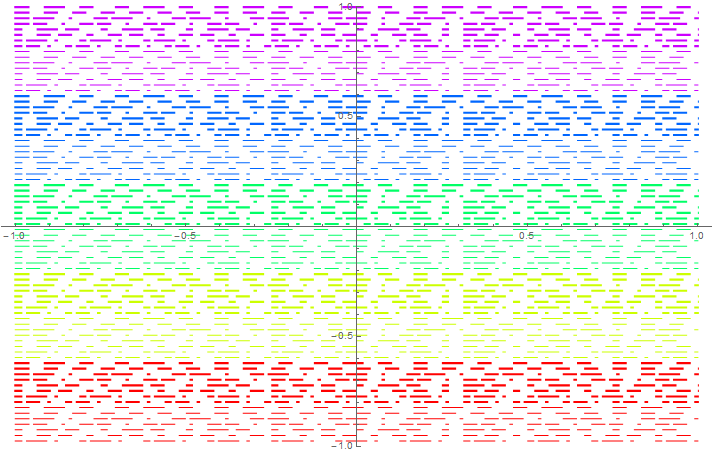
Here for 80 distinctive styles.

Block[
 {
  styles = Flatten[
    Table[
     {Hue[h], Thickness[t], Dashing[{d1, d2, d3}]}
     , {h, 0, 0.9, 0.2}
     , {t, {0.001, 0.003}}
     , {d1, {0.01, 0.02}}
     , {d2, {0.005, 0.02}}
     , {d3, {0.02, 0.03}}], 4]
  },
 Plot[
  Evaluate@Table[y, {y, -1, 1, 2/(Length[styles] - 1)}]
  , {x, -1, 1}
  , PlotRange -> {-1, 1}
  , PlotStyle -> styles
  ]]

Mathematica graphics

If you want to encode information in the dashing using Morse code, see this question

$\endgroup$
3
  • 5
    $\begingroup$ Yes, but does the Morse code say anything nice? $\endgroup$
    – rcollyer
    Commented Nov 21, 2014 at 19:17
  • $\begingroup$ @rcollyer challenge accepted, please see here $\endgroup$
    – rhermans
    Commented Nov 21, 2014 at 21:11
  • $\begingroup$ @rhermans Thank you very much for providing an extensive list of dashing styles and options. $\endgroup$
    – zenith
    Commented Nov 24, 2014 at 10:51

Your Answer

By clicking “Post Your Answer”, you agree to our terms of service and acknowledge you have read our privacy policy.

Not the answer you're looking for? Browse other questions tagged or ask your own question.