I know only three plot style
m = 1;
w = 1;
U = m*w^2 z^2/2;
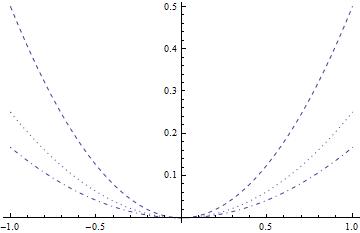
p1 = Plot[U, {z, -1, 1}, PlotStyle -> Dashed]
p2 = Plot[U/2, {z, -1, 1}, PlotStyle -> Dotted]
p3 = Plot[U/3, {z, -1, 1}, PlotStyle -> DotDashed]
Show[p1, p2, p3] ![Superimposed, p1, p2, p3][2]
as shown. How to get more options for line style as I need to show more plots and I also need to show the legends to specify which plot is corresponding to what.


