replaced http://mathematica.stackexchange.com/ with https://mathematica.stackexchange.com/
Source Link

You can read the documentation of PlotStyle under Details.

Using Thickness, Dashing and RGBColor or Hue may help.

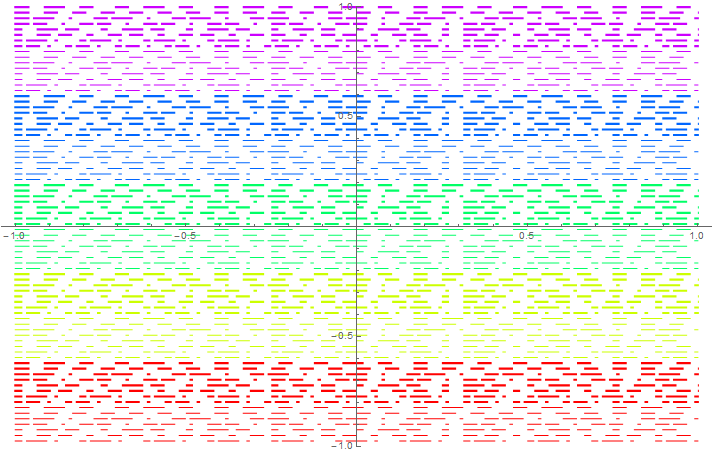
Here for 80 distinctive styles.

Block[
 {
  styles = Flatten[
    Table[
     {Hue[h], Thickness[t], Dashing[{d1, d2, d3}]}
     , {h, 0, 0.9, 0.2}
     , {t, {0.001, 0.003}}
     , {d1, {0.01, 0.02}}
     , {d2, {0.005, 0.02}}
     , {d3, {0.02, 0.03}}], 4]
  },
 Plot[
  Evaluate@Table[y, {y, -1, 1, 2/(Length[styles] - 1)}]
  , {x, -1, 1}
  , PlotRange -> {-1, 1}
  , PlotStyle -> styles
  ]]

Mathematica graphics

If you want to encode information in the dashing using Morse code, see this questionthis question

You can read the documentation of PlotStyle under Details.

Using Thickness, Dashing and RGBColor or Hue may help.

Here for 80 distinctive styles.

Block[
 {
  styles = Flatten[
    Table[
     {Hue[h], Thickness[t], Dashing[{d1, d2, d3}]}
     , {h, 0, 0.9, 0.2}
     , {t, {0.001, 0.003}}
     , {d1, {0.01, 0.02}}
     , {d2, {0.005, 0.02}}
     , {d3, {0.02, 0.03}}], 4]
  },
 Plot[
  Evaluate@Table[y, {y, -1, 1, 2/(Length[styles] - 1)}]
  , {x, -1, 1}
  , PlotRange -> {-1, 1}
  , PlotStyle -> styles
  ]]

Mathematica graphics

If you want to encode information in the dashing using Morse code, see this question

added 152 characters in body
Source Link
rhermans
  • 37.4k
  • 4
  • 61
  • 152

You can read the documentation of PlotStyle under Details.

Using Thickness, Dashing and RGBColor or Hue may help.

Here for 80 distinctive styles.

Block[
 {
  styles = Flatten[
    Table[
     {Hue[h], Thickness[t], Dashing[{d1, d2, d3}]}
     , {h, 0, 0.9, 0.2}
     , {t, {0.001, 0.003}}
     , {d1, {0.01, 0.02}}
     , {d2, {0.005, 0.02}}
     , {d3, {0.02, 0.03}}], 4]
  },
 Plot[
  Evaluate@Table[y, {y, -1, 1, 2/(Length[styles] - 1)}]
  , {x, -1, 1}
  , PlotRange -> {-1, 1}
  , PlotStyle -> styles
  ]]

Mathematica graphics

If you want to encode information in the dashing using Morse code, see this question

You can read the documentation of PlotStyle under Details.

Using Thickness, Dashing and RGBColor or Hue may help.

Here for 80 distinctive styles.

Block[
 {
  styles = Flatten[
    Table[
     {Hue[h], Thickness[t], Dashing[{d1, d2, d3}]}
     , {h, 0, 0.9, 0.2}
     , {t, {0.001, 0.003}}
     , {d1, {0.01, 0.02}}
     , {d2, {0.005, 0.02}}
     , {d3, {0.02, 0.03}}], 4]
  },
 Plot[
  Evaluate@Table[y, {y, -1, 1, 2/(Length[styles] - 1)}]
  , {x, -1, 1}
  , PlotRange -> {-1, 1}
  , PlotStyle -> styles
  ]]

Mathematica graphics

If you want to encode information in the dashing using Morse code, see this question

deleted 24 characters in body
Source Link
rhermans
  • 37.4k
  • 4
  • 61
  • 152

You can read the documentation of PlotStyle under Details.

Using Thickness, Dashing and RGBColor or Hue may help.

Here for 80 distinctive styles, using Hue instead of RGBColor.

Block[
 {
  styles = Flatten[
    Table[
     {Hue[h], Thickness[t], Dashing[{d1, d2, d3}]}
     , {h, 0, 0.9, 0.2}
     , {t, {0.001, 0.003}}
     , {d1, {0.01, 0.02}}
     , {d2, {0.005, 0.02}}
     , {d3, {0.02, 0.03}}], 4]
  },
 Plot[
  Evaluate@Table[y, {y, -1, 1, 2/(Length[styles] - 1)}]
  , {x, -1, 1}
  , PlotRange -> {-1, 1}
  , PlotStyle -> styles
  ]]

Mathematica graphics

You can read the documentation of PlotStyle under Details.

Using Thickness, Dashing and RGBColor may help.

Here for 80 distinctive styles, using Hue instead of RGBColor

Block[
 {
  styles = Flatten[
    Table[
     {Hue[h], Thickness[t], Dashing[{d1, d2, d3}]}
     , {h, 0, 0.9, 0.2}
     , {t, {0.001, 0.003}}
     , {d1, {0.01, 0.02}}
     , {d2, {0.005, 0.02}}
     , {d3, {0.02, 0.03}}], 4]
  },
 Plot[
  Evaluate@Table[y, {y, -1, 1, 2/(Length[styles] - 1)}]
  , {x, -1, 1}
  , PlotRange -> {-1, 1}
  , PlotStyle -> styles
  ]]

Mathematica graphics

You can read the documentation of PlotStyle under Details.

Using Thickness, Dashing and RGBColor or Hue may help.

Here for 80 distinctive styles.

Block[
 {
  styles = Flatten[
    Table[
     {Hue[h], Thickness[t], Dashing[{d1, d2, d3}]}
     , {h, 0, 0.9, 0.2}
     , {t, {0.001, 0.003}}
     , {d1, {0.01, 0.02}}
     , {d2, {0.005, 0.02}}
     , {d3, {0.02, 0.03}}], 4]
  },
 Plot[
  Evaluate@Table[y, {y, -1, 1, 2/(Length[styles] - 1)}]
  , {x, -1, 1}
  , PlotRange -> {-1, 1}
  , PlotStyle -> styles
  ]]

Mathematica graphics

deleted 59 characters in body
Source Link
rhermans
  • 37.4k
  • 4
  • 61
  • 152
Loading
Source Link
rhermans
  • 37.4k
  • 4
  • 61
  • 152
Loading