0
$\begingroup$

I want to graph this function:

DivisorSigma[1,x]-(x+1)

However, I only want to plot the points that satisfy other conditions:

DivisorSigma[0,x]-2=2

and

Mod[x,2]=1

Is that possible within Mathematica?

$\endgroup$
0

2 Answers 2

2
$\begingroup$

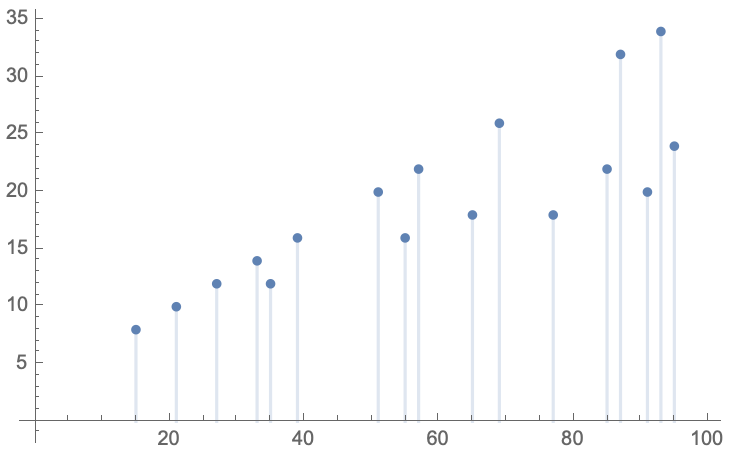
You could always use Piecewise or ConditionalExpression:

f[x_] = ConditionalExpression[
  DivisorSigma[1, x] - (x + 1), 
  Mod[x, 2] == 1 && DivisorSigma[0, x] - 2 == 2
];

DiscretePlot[f[x], {x, 1, 100}, PlotMarkers -> {Automatic, 6}]
$\endgroup$
1
  • $\begingroup$ Thank you! This could be exactly what I need! $\endgroup$
    – DUO Labs
    Commented Jul 5, 2019 at 0:23
1
$\begingroup$
{#,DivisorSigma[1,#]-(#+1)}&/@Select[Range[100],DivisorSigma[0,#]-2==2&&OddQ[#]&]
ListPlot[%]
$\endgroup$
4
  • $\begingroup$ Thank you, but what about the "Mod" part? $\endgroup$
    – DUO Labs
    Commented Jul 4, 2019 at 1:49
  • $\begingroup$ And I don't want to list the points. $\endgroup$
    – DUO Labs
    Commented Jul 4, 2019 at 1:50
  • $\begingroup$ Is there a way to plot multiple functions at the same time with this command $\endgroup$
    – DUO Labs
    Commented Jul 4, 2019 at 2:05
  • $\begingroup$ Yes. Read the documentation for ListPlot. $\endgroup$ Commented Jul 4, 2019 at 12:36

Your Answer

By clicking “Post Your Answer”, you agree to our terms of service and acknowledge you have read our privacy policy.

Not the answer you're looking for? Browse other questions tagged or ask your own question.