I'm facing a problem with RandomReal when using ListPlot to plot some constrained points. I found that at every run of MA kernel the graph's points changes. In details, suppose for instance, functions:
k1[s_, d_] := 3 s + 5 d

k2[s_, d_] := 5 s - 7 d
I'm using the following to plot conditional k1 and k2 in (s,d) plan
ClearAll[ps]

ps = Transpose[{RandomReal[{0.1, 2.}, 1000], RandomReal[{-1, 3}, 1000]}];

styleps =
  Style[{##}, PointSize[.01],
     Piecewise[{{Blue, 0 < k1[#, #2] <= 1 && 0 < k2[#, #2] <= 2}},
      White]] & @@@ ps;

ListPlot[styleps, DataRange -> {{-1, 1}, {-1, 1}}, Frame -> True,
 GridLines -> {Table[i, {i, 0, 2, 0.1}], Table[i, {i, -1, 3, 0.2}]},
 ImageSize -> 500, Axes -> False, GridLinesStyle -> Lighter[Gray]]
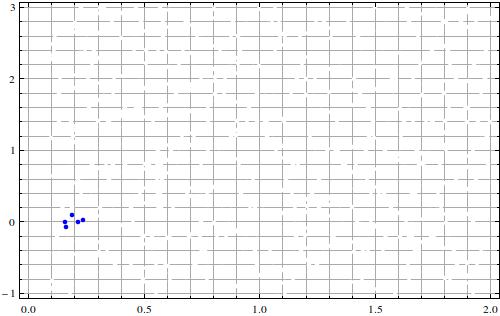
Now for the first run this gives:
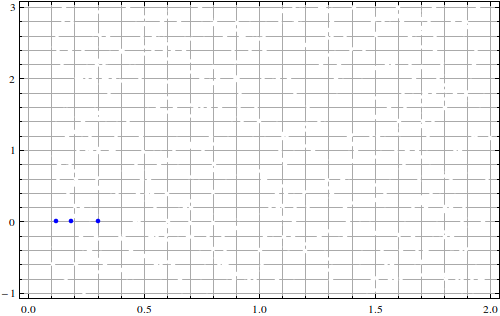
While if I make ClearAll[ps] and rerun or quit the kernel and started again, this gives totally different points, such as:
This is expected from RandomReal because it generates random points each time, but this is totally confusing in this case , because how one can determine all real points which satisfy the required condition if in each run only some points are appear ?
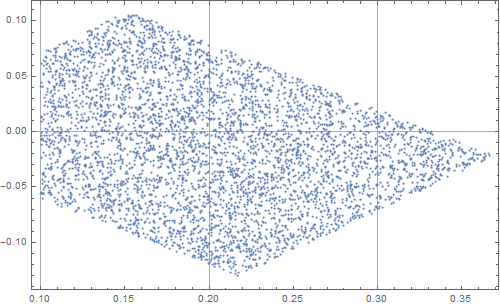
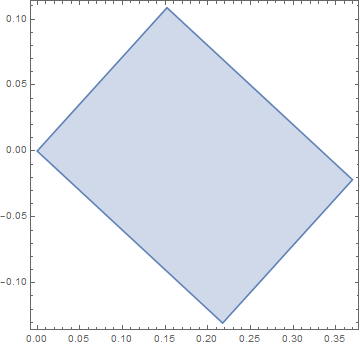
So any suggestions to improve this code to can plot whole points of of s versus d for which k1 and k2 conditions are satisfied for any run?


SeedRandomcall with an appropriate seed to get identical output fromRandomRealevery time you run it. $\endgroup$RandomRealfrom the beginning and generate points in more efficient way ? $\endgroup$SeedRandomin my example ? $\endgroup$