I have a 2D scatter plot. I want to define a circular region in this plot and use the data points inside the circular region for further analysis. Is there any way to do this and plot the two set of points?
4 Answers
$\begingroup$
$\endgroup$
4
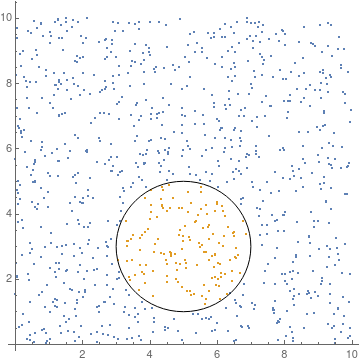
Using Select and Norm:
pts = RandomReal[10, {1000, 2}];
center = {5, 3};
radius = 2;
good = Select[pts, Norm[# - center] < radius &];

Show[ListPlot[{pts, good}], Graphics@Circle[center, radius],  AspectRatio -> 1]
-
$\begingroup$ Your last line could be a bit simpler
ListPlot[{pts, good}, AspectRatio -> Automatic, Epilog -> Circle[center, radius]];-) $\endgroup$ Commented Apr 18, 2018 at 20:04 -
$\begingroup$ That's right :) Could you explain why
AspectRatio -> Automaticis not the same as default? $\endgroup$ Commented Apr 18, 2018 at 20:34 -
$\begingroup$ This should give you a hint:
GoldenRatio AspectRatio /. AbsoluteOptions[ListPlot[{}]]$\endgroup$ Commented Apr 18, 2018 at 21:46 -
$\begingroup$ @VitaliyKaurov I don't know why I expect
Automaticsettings to be default. A bit like inNDSolve,Method -> Automaticdoes not change anything (afaik). $\endgroup$ Commented Apr 19, 2018 at 1:14
$\begingroup$
$\endgroup$
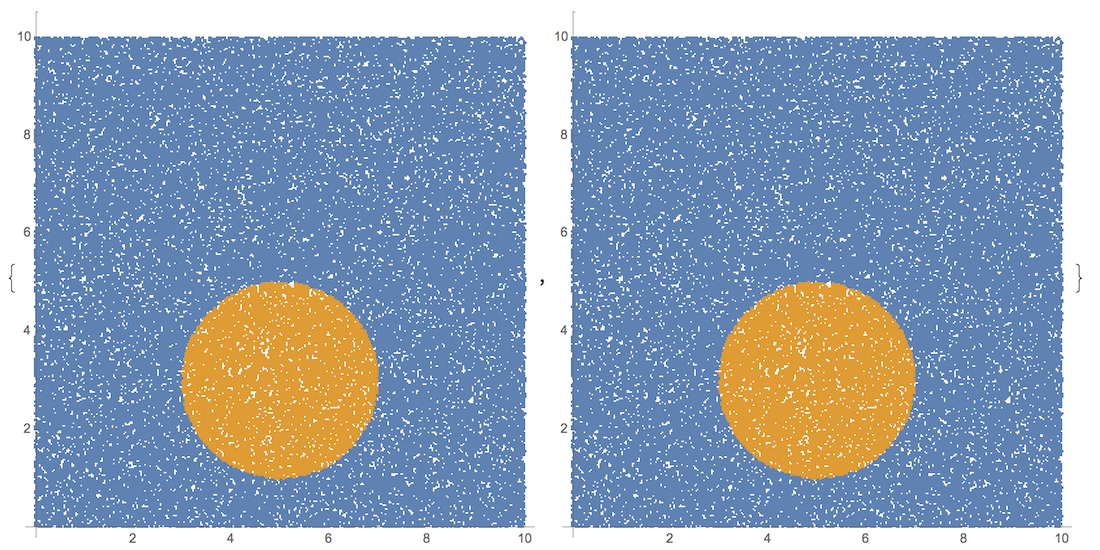
I'd use Nearest instead of Select, as it is much faster. Compare
pts = RandomReal[10, {10^5, 2}];
center = {5, 3};
radius = 2;

sub1 = Select[pts, Norm[# - center] < radius &]; // AbsoluteTiming
{0.538735`, Null}
sub2 = Nearest[pts, center, {All, radius}]; // AbsoluteTiming
{0.002293`, Null}
ListPlot[{pts, #}, ImageSize -> 400, AspectRatio -> Automatic] & /@ {sub1, sub2}
The points sets might differ due to different boundary inclusion interpretation by Nearest and Select. But those could be easily adjusted by the radius value.
$\begingroup$
$\endgroup$
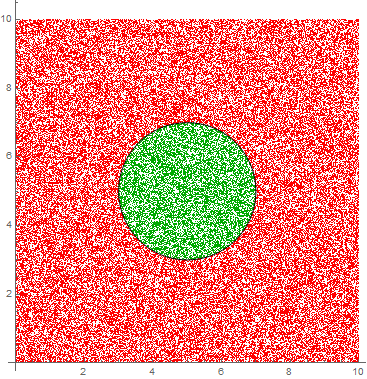
Using RegionMember:
SeedRandom[1];
pts = RandomReal[10, {10^5, 2}];
center = {5, 5};
radius = 2;
good = Select[pts, RegionMember[Disk[center, radius]]];
outside = Complement[pts, good];

ListPlot[{outside, good}
 , AspectRatio -> Automatic
 , PlotStyle -> {Directive[AbsolutePointSize[1], Red],
   Directive[AbsolutePointSize[1], Darker@Green] }
 , Epilog -> {Circle[center, radius]
   }
 ]
$\begingroup$
$\endgroup$
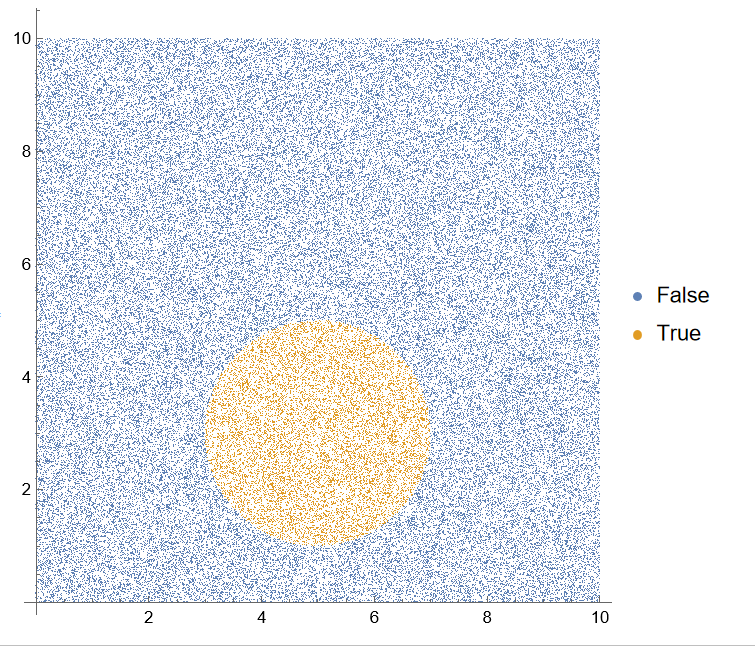
Using GroupBy
pts = RandomReal[10, {10^5, 2}];
f[lst_, c_, r_] := GroupBy[lst, (# - c) . (# - c) < r^2 &];
ListPlot[f[pts, {5, 3}, 2], AspectRatio -> Automatic]


