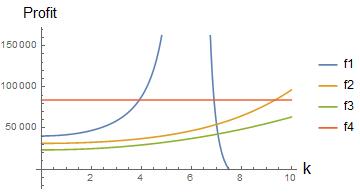
i am trying to plot multiple functions in mathematica but i would like to do this in such a way that the values of two of my functions are always greater than the other two.
my functions are:
enter code here
f1[a_, b_, k_, t_,
  d_] := -((16 k^2 *t (3 a + (8 k^2* a)/(-4 k^2 + 6 b *t))^2)/(
   81 b^2 (-((4 k^2)/(9 b)) + 2 t)^2)) + (a + (
    4 k^2 (3 a + (8 k^2 *a)/(-4 k^2 + 6 b* t)))/(
    9 b (-((4 k^2)/(9 b)) + 2 t)))^2/b

f2[a_, b_, k_, t_,
  d_] := ((2 a + d) + 2 k*((6 k* a + 3 k *d)/(-4 k + 18 b *t)))/(
   3 b)*((2 a + d) + k*((6 k* a + 3 k *d)/(-4 k + 18 b *t)))/
   3  - (t*((6 k* a + 3 k *d)/(-4 k + 18 b *t))^2)

f3[a_, b_, k_, t_,
  d_] := ((a + 2 d) (a + 2 d + (
    2 k (6 k* a + 3 k *d))/(-4 k + 18 b *t)))/(9 b)

f4[a_, b_, k_, t_, d_] := d^2
I have entered the following numerical values because I only want a 2D plot showing the results in accordance to the remaining variable which is k.:
a = 450
d = 290
b = 5
t = 5
I want f1 to be greater that f3 for all values of k and f4 to be greater that f2. I have tried the following code as well as several other formats but I keep getting the same graph
Plot[{f1[a, b, k, t, d], f2[a, b, k, t, d], f3[a, b, k, t, d],
  f4[a, b, k, t, d]}, {k, 0, 10},
 AxesLabel -> {Style["k", 17, Black], Style["Profit", 15, Black]},
 PlotLegends -> Placed[{"f1", "f2", "f3", "f4"}, {1, 0.5}],
 RegionFunction -> (#2 >= 0 && f1 > f3 && f4 > f2 &)]
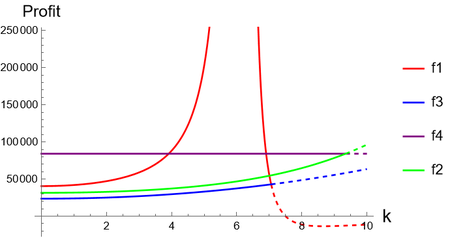
when I do not add the conditions f1>f3 and f4>f2, I get the above graph. When added, I gives me the same graph. I also need parts of the graph that satisfies the aforementioned conditions to be plotted in bold line style, and the remaining part to be shown in dashed line. This is while I cannot even get the desired parts printed. What should I do? Thanks in advance


ConditionalExpression, e.g.,f1cond[a_, b_, k_, t_, d_] = ConditionalExpression[f1[a, b, k, t, d], f1[a, b, k, t, d] > f3[a, b, k, t, d]] // FullSimplify;$\endgroup$