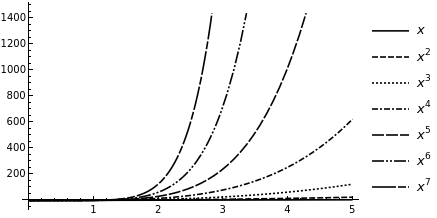
Suppose I have to plot 7 function in a single plot, a toy example may be
Plot[Table[x^i, {i, 7}], {x, 0, 5}]
This gives me a plot including 7 blue lines, but I want to plot them so that every single curve can be distinguishable. There is PlotMarkers option for ListPlot which does this in a best way, I want such a equivalent here. Since I guess you suggest the following solutions I write my reason for not using them:
- Using colors: I want to print my plots in black and white
- Using Plot style: there are limited plot styles for for using: solid, dashed,dotted,dott-dashed which are not enough for showing 7 functions for example.
- Calculating points using
Tableand then plotting them byListPlot: The distribution of points of my functions are not suitable for doing this and the overall shape of function isn't identified clearly. - Using Thickness: Since there are many functions, thickness of curves are not distinguishable.
Any idea?


Plot[Evaluate@Table[x^i, {i, 7}], {x, 0, 5}, PlotTheme -> "Monochrome",PlotLegends->"Expressions"]? $\endgroup$ListLinePlotand usePlotMarkersof your choice? $\endgroup$ScalingFunctionsto reduce plot congestion:Plot[Evaluate@Table[x^i, {i, 7}], {x, 0, 5}, PlotTheme -> "Monochrome", PlotLegends -> LineLegend["Expressions", LegendLayout -> "ReversedColumn"] , ScalingFunctions -> {None, "Log"}]$\endgroup$Callout? $\endgroup$