4
$\begingroup$

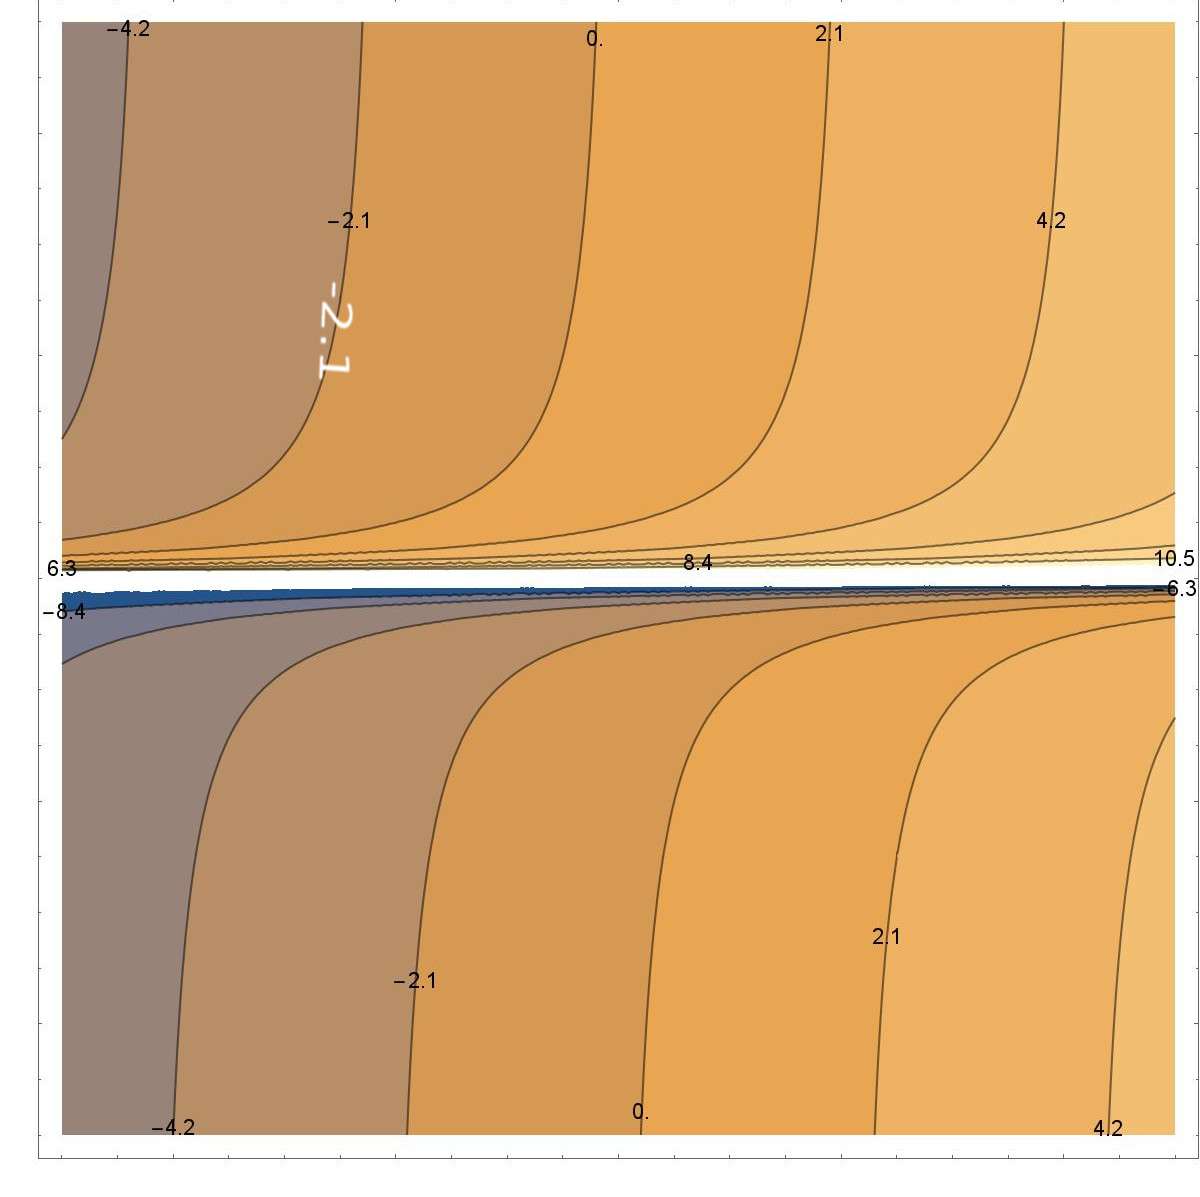
I have a contour plot. I want to make some changes in the contour labels. I want them to place along each contour in white color. Here is my code

ClearAll["Global`*"];
f[x_, y_] := x + y^-1;
p = ContourPlot[
f[x, y], {x, -5, 5}, {y, -5, 5},
Contours -> 10,
ContourLabels -> True,
LabelStyle -> {Directive[Bold, Medium], White, 
RotateLabel -> True},
ImageSize -> Large
]

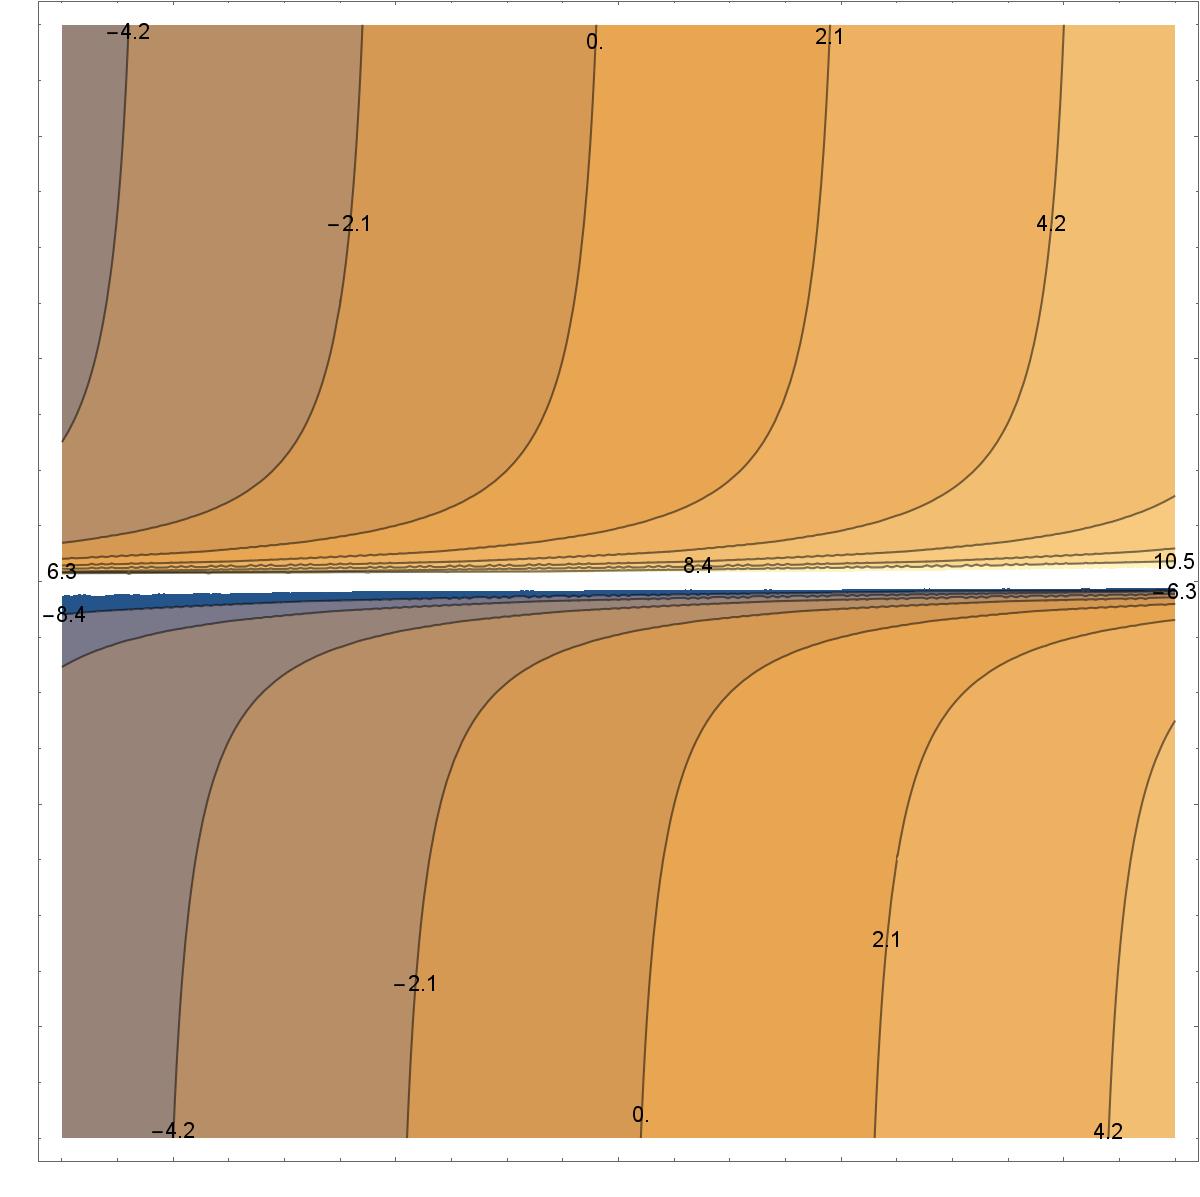
The output of this code is

enter image description here

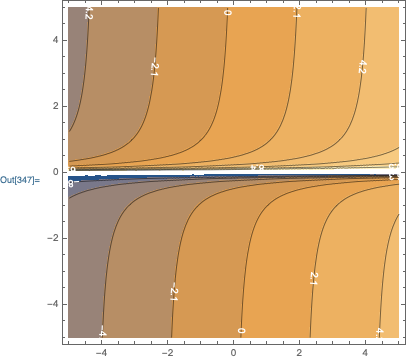
but I want something like this

enter image description here

How can I figure it out? Many thanks.
$\endgroup$

1 Answer 1

4
$\begingroup$

You can use a pure function with a Text object as the ContourLabels option setting. The fourth argument of Text specifies the direction, which can be computed with:

f[x_, y_] := x + y^-1
t[x_, y_] = Grad[f[x, y], {x, y}] . {{0, -1}, {1, 0}};

Then:

ContourPlot[
    f[x, y],
    {x,-5,5},
    {y,-5,5},
    Contours->10,
    ContourLabels->Function[{x,y,z},Text[z,{x,y},{0,0},t[x,y], BaseStyle->FontColor->White]]
]

enter image description here

$\endgroup$
2
  • $\begingroup$ To make the contour labels more readable (i.e., no upside down contour labels), I've added in the 'function t2[z_] := If[z[[1]] < 0 && z[[2]] < 0, -z, If[z[[1]] < 0, {-z[[1]], z[[2]]}, z]]` and replaced t[x, y] with t2[t[x, y]]. Is there a better way? (Is this a separate question?) $\endgroup$
    – JimB
    Commented Dec 6, 2019 at 6:57
  • $\begingroup$ After looking at this a bit more just using Sign[t[x, y][[1]]] t[x, y] in place of t[x, y] seems to do the trick. $\endgroup$
    – JimB
    Commented Dec 7, 2019 at 16:14

Your Answer

By clicking “Post Your Answer”, you agree to our terms of service and acknowledge you have read our privacy policy.

Not the answer you're looking for? Browse other questions tagged or ask your own question.