1
$\begingroup$

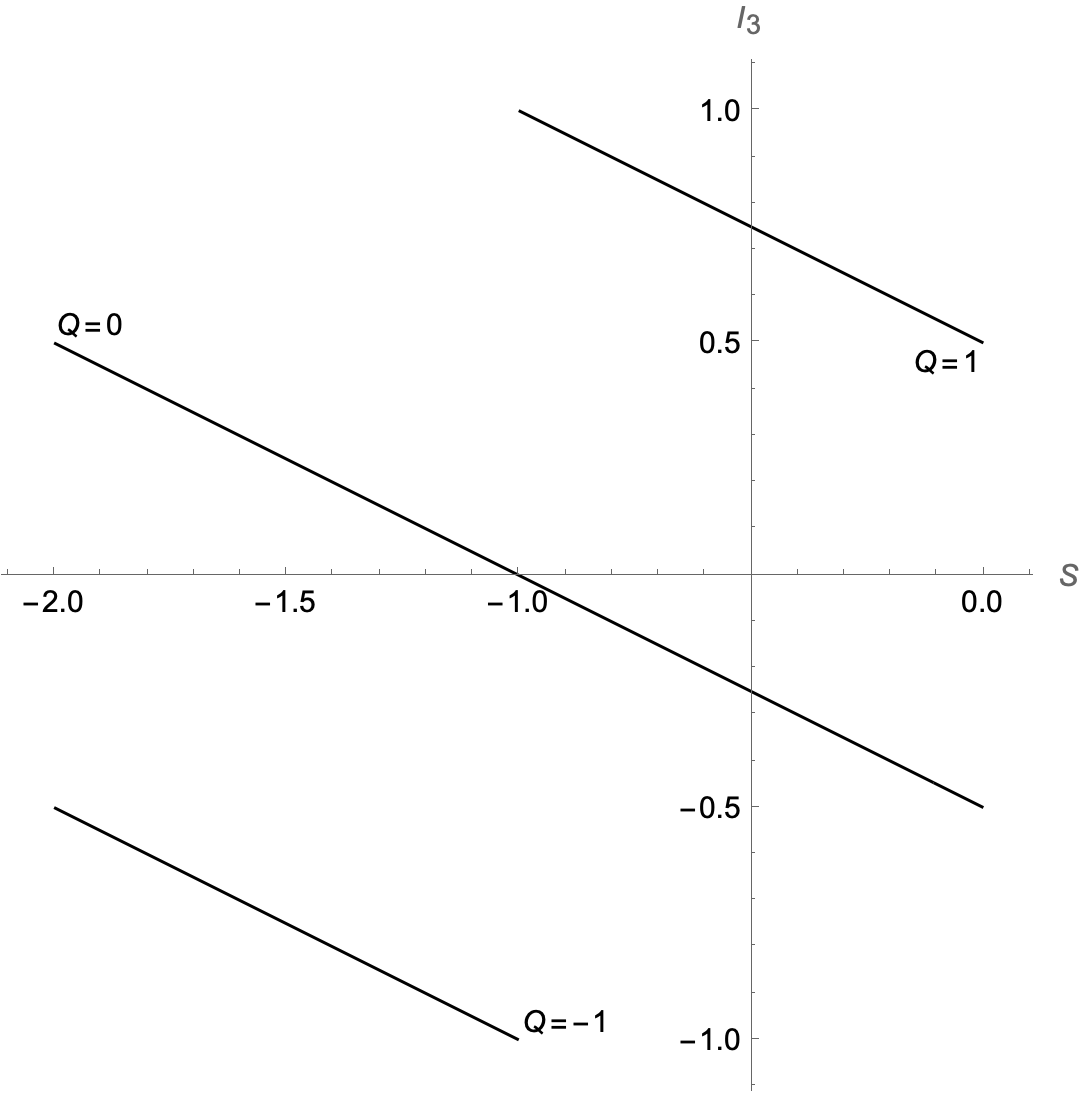
I want to label several contours in one graph. First, I drew three lines 1 == ii3 + (1 + ss)/2, 0 == ii3 + (1 + ss)/2, and 1 == ii3 + (1 + ss)/2} with ContourPlot and used ContourLabels to add labels:

ContourPlot[{-1 == ii3 + (1 + ss)/2, 0 == ii3 + (1 + ss)/2, 
  1 == ii3 + (1 + ss)/2}, {ss, -2, 0}, {ii3, -1, 1}, Frame -> False, 
 Axes -> True, AxesLabel -> {S, "\!\(\*SubscriptBox[\(I\), \(3\)]\)"},
  ContourLabels -> {"Q=-1", "Q=0", "Q=1"}]

enter image description here

It does not show labels at all. How can I get the labels of each contours?

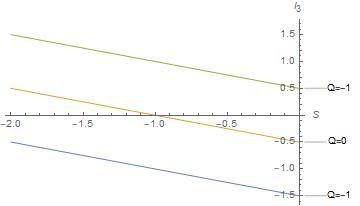
I know that I can get a similar figure with:

Plot[{-(1 + ss)/2 - 1, -(1 + ss)/2, 1 - (1 + ss)/2}, {ss, -2, 0}, 
 AxesLabel -> {S, "\!\(\*SubscriptBox[\(I\), \(3\)]\)"}, 
 PlotLabels -> {"Q=-1", "Q=0", "Q=-1"}]

enter image description here

However, there are many curves that can be drawn with ContourPlot but cannot be drawn with Plot. Is there any way to add labels in Contourplot?

$\endgroup$
1
  • $\begingroup$ See here, here, and here $\endgroup$
    – MelaGo
    Commented Sep 18, 2023 at 3:56

1 Answer 1

1
$\begingroup$
$Version

(* "13.3.1 for Mac OS X ARM (64-bit) (July 24, 2023)" *)

Clear["Global`*"]

ContourPlot[ii3 + (1 + ss)/2,
 {ss, -2, 0}, {ii3, -1, 1},
 Contours -> {-1, 0, 1},
 ContourShading -> None,
 Frame -> False,
 Axes -> True,
 AxesOrigin -> {-0.5, 0},
 AxesLabel -> {S, "\!\(\*SubscriptBox[\(I\), \(3\)]\)"},
 ContourLabels -> (Text[
     StringForm["``\[ThinSpace]=\[ThinSpace]``", HoldForm[Q], #3],
     {#1, #2}, 1.1 Sign[#1 + 1] {1, 1},
     Background -> White] &),
 PlotRangePadding -> Scaled[.05],
 PlotRangeClipping -> False]

enter image description here

$\endgroup$

Your Answer

By clicking “Post Your Answer”, you agree to our terms of service and acknowledge you have read our privacy policy.

Not the answer you're looking for? Browse other questions tagged or ask your own question.