Predict["NameAge", "Claire"]
8
distribution = Predict["NameAge", "Claire", "Distribution"]


dataRaw = distribution[[2]]
{{0.0436854,0.0434454,0.0417851,0.0410707,0.039174,0.0392846,0.0341221,0.0297407,0.0301554,0.0321928,0.0306963,0.0328238,0.0335628,0.0337617,0.0329839,0.0274761,0.0247628,0.0226914,0.0199307,0.0174267,0.0178853,0.016748,0.0156118,0.0142017,0.0121872,0.0112472,0.0110289,0.0101354,0.0083158,0.00727845,0.00693834,0.00579045,0.00500136,0.00476404,0.00422787,0.0042015,0.00330494,0.00382356,0.00353463,0.00397766,0.00267746,0.0029375,0.00324305,0.00358885,0.00338324,0.00364493,0.00472906,0.00431149,0.00502461,0.005541,0.00667215,0.00666396,0.00624235,0.00699836,0.00670012,0.00723419,0.006929,0.00514928,0.00543192,0.0056786,0.00566318,0.00556554,0.00404206,0.00422927,0.00398858,0.00459221,0.00433242,0.00287366,0.00315304,0.00314997,0.00326664,0.00302409,0.00243289,0.00236613,0.00272464,0.00246009,0.00277903,0.0011675,0.00135807,0.00141423,0.00155165,0.00169708,0.00113741,0.00117819,0.00120093,0.00127315,0.00115479,0.000524236,0.00055232,0.000490803,0.000470074,0.000428617},{7,8,9,10,11,12,13,14,15,16,17,18,19,20,21,22,23,24,25,26,27,28,29,30,31,32,33,34,35,36,37,38,39,40,41,42,43,44,45,46,47,48,49,50,51,52,53,54,55,56,57,58,59,60,61,62,63,64,65,66,67,68,69,70,71,72,73,74,75,76,77,78,79,80,81,82,83,84,85,86,87,88,89,90,91,92,93,94,95,96,97,98,99}}
Length /@ dataRaw
{92,93}
Let's see this distribution, its domain is from 7 to 99, which means there would be no age below 8 will be given, since the first interval is [7,8)?
Why?
data // Length
100
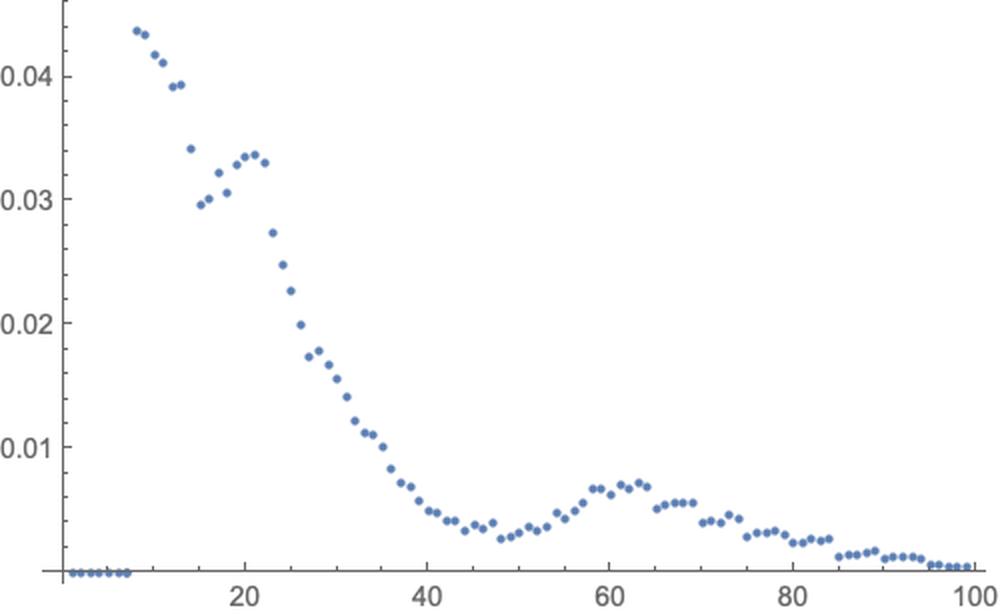
ListPlot@data
If we use PDF to extract data, we can see there is a zero in the end of list.
pdf[x_] := PDF[distribution, x]


list = Table[pdf[x], {x, 0, 99}]
{0,0,0,0,0,0,0,0.0436854,0.0434454,0.0417851,0.0410707,0.039174,0.0392846,0.0341221,0.0297407,0.0301554,0.0321928,0.0306963,0.0328238,0.0335628,0.0337617,0.0329839,0.0274761,0.0247628,0.0226914,0.0199307,0.0174267,0.0178853,0.016748,0.0156118,0.0142017,0.0121872,0.0112472,0.0110289,0.0101354,0.0083158,0.00727845,0.00693834,0.00579045,0.00500136,0.00476404,0.00422787,0.0042015,0.00330494,0.00382356,0.00353463,0.00397766,0.00267746,0.0029375,0.00324305,0.00358885,0.00338324,0.00364493,0.00472906,0.00431149,0.00502461,0.005541,0.00667215,0.00666396,0.00624235,0.00699836,0.00670012,0.00723419,0.006929,0.00514928,0.00543192,0.0056786,0.00566318,0.00556554,0.00404206,0.00422927,0.00398858,0.00459221,0.00433242,0.00287366,0.00315304,0.00314997,0.00326664,0.00302409,0.00243289,0.00236613,0.00272464,0.00246009,0.00277903,0.0011675,0.00135807,0.00141423,0.00155165,0.00169708,0.00113741,0.00117819,0.00120093,0.00127315,0.00115479,0.000524236,0.00055232,0.000490803,0.000470074,0.000428617,0}
list // Length
100
Some confusions like:
If we maximize the pdf function, we can get 7.
Maximize[pdf[x], x]
{0.0436854,{x->7.01018}}
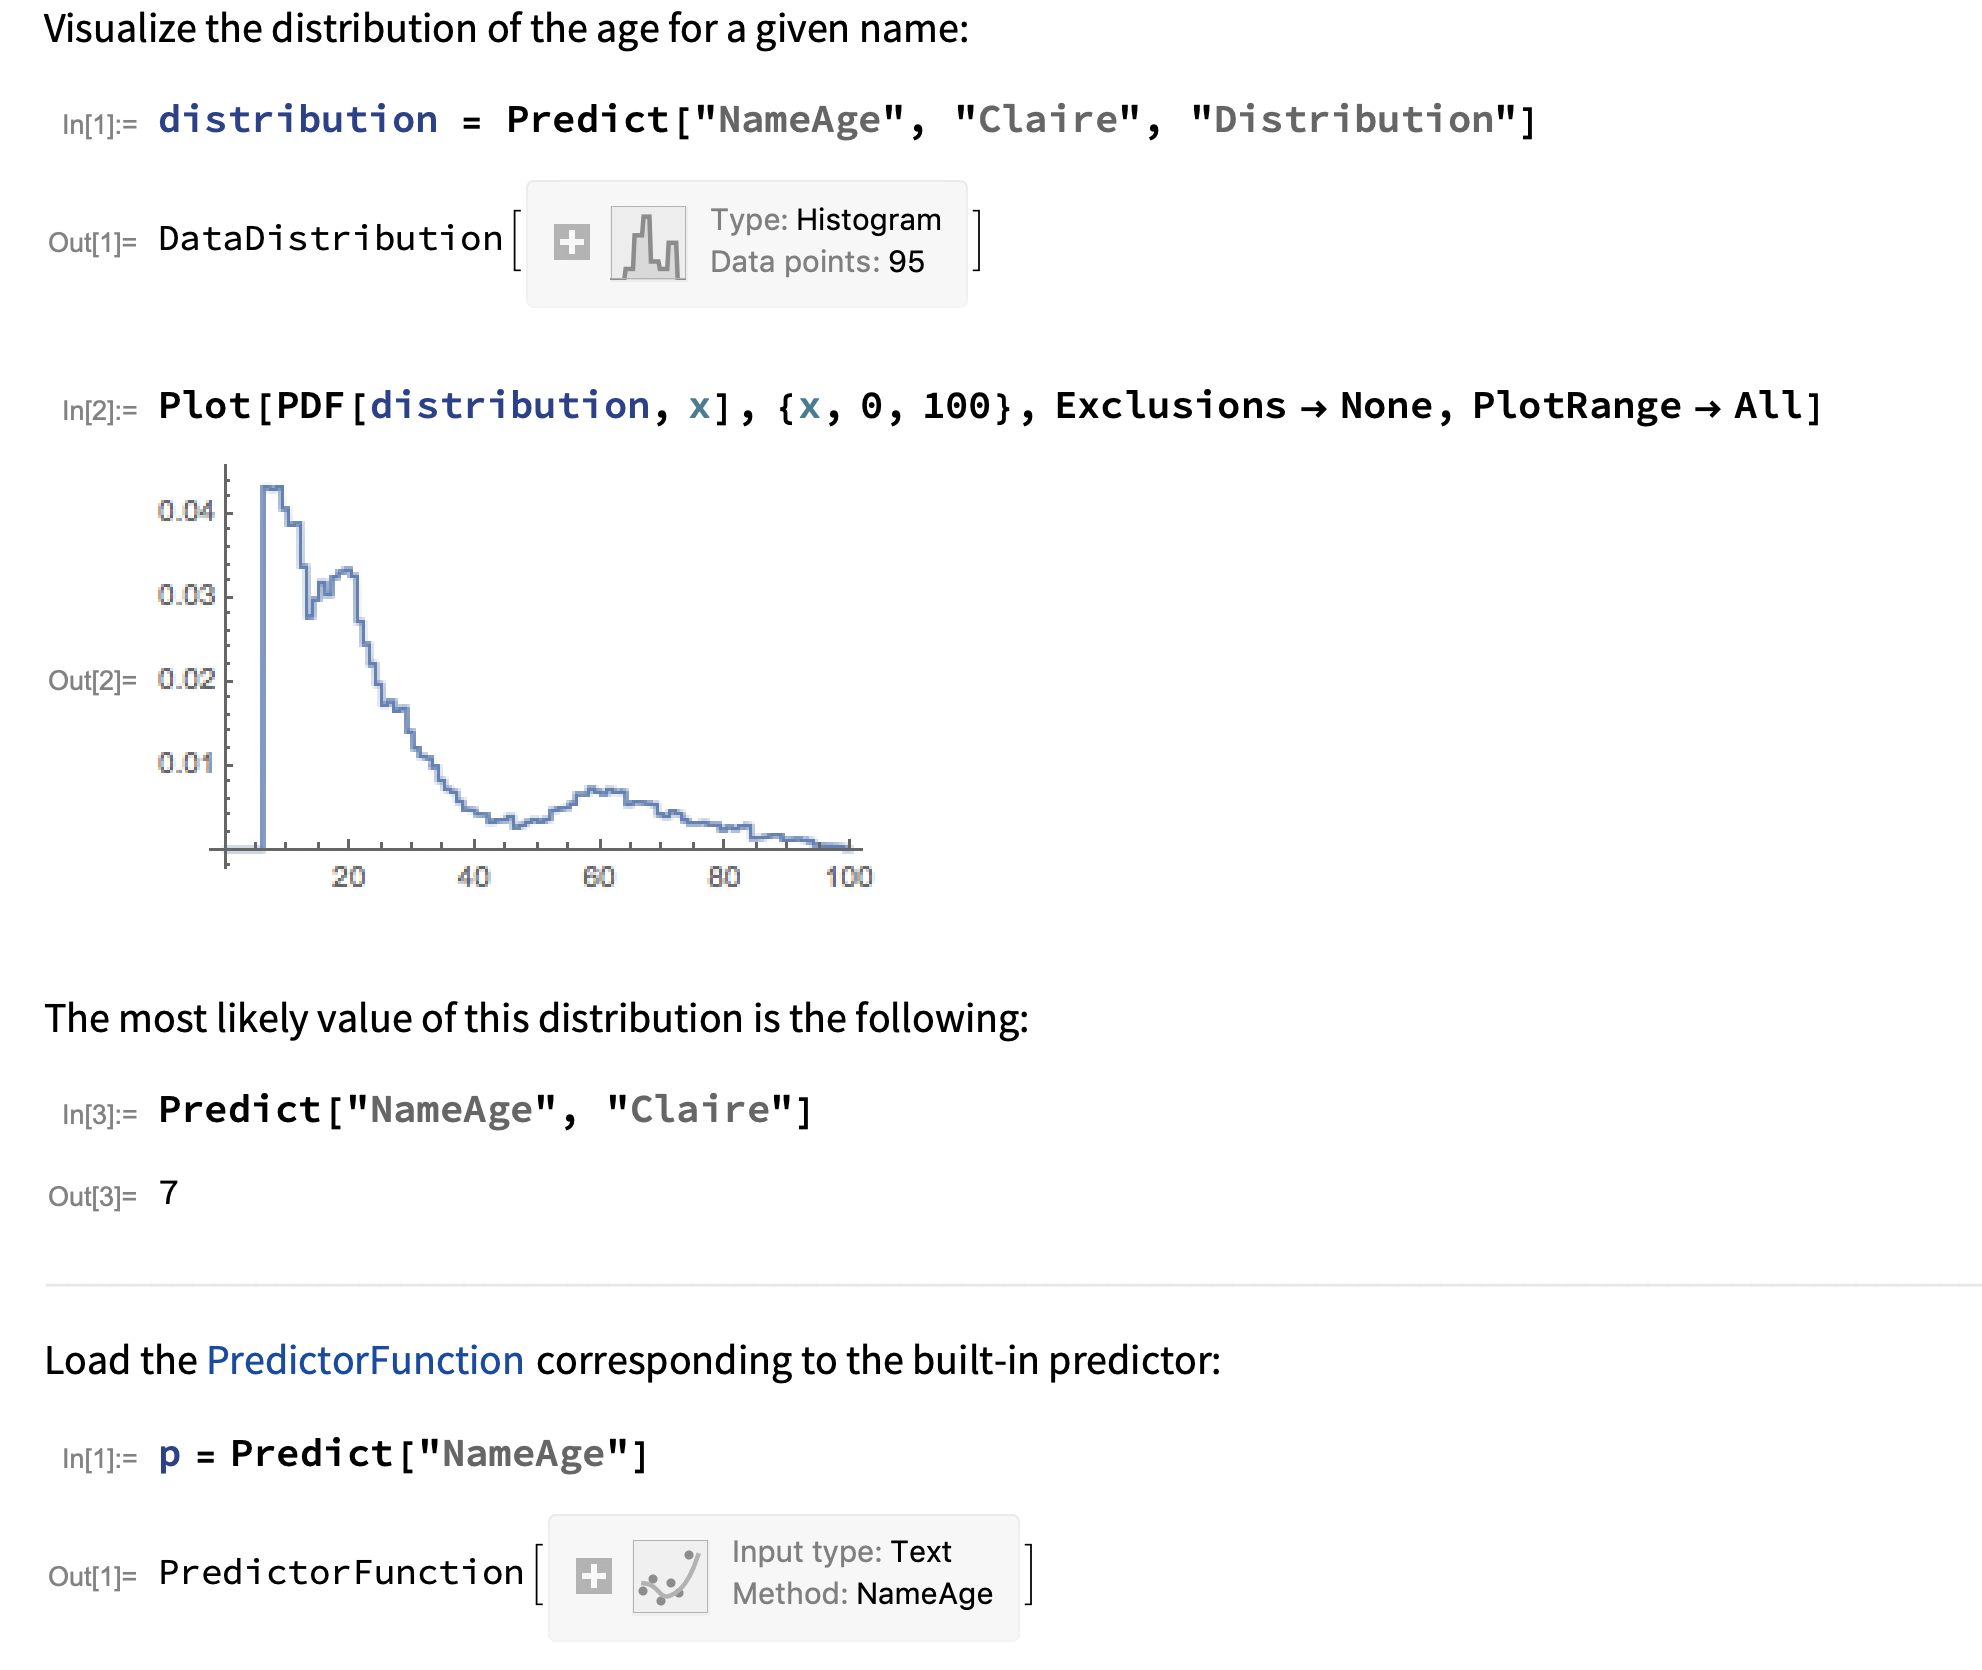
In the HelpPage of ref/predictor/NameAge The default result is 7! But re-run, it gives 8.


