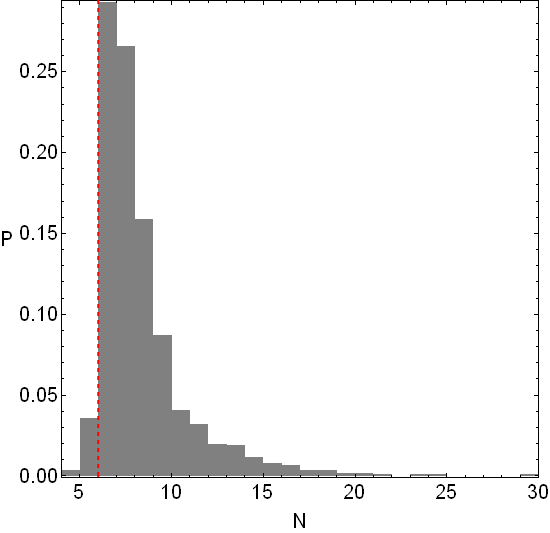
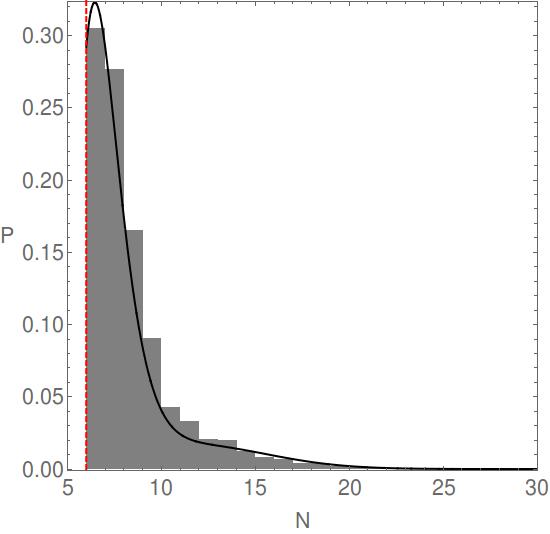
Here is a sample of data which corresponds to the following histogram
data = Flatten[Import["hist.dat", "Table"], 1];

P00 = Histogram[data, Automatic, "Probability", ChartStyle -> Gray,
      ChartBaseStyle -> EdgeForm[None], Frame -> True,
      FrameLabel -> {"N", "P"}, RotateLabel -> False,
      LabelStyle -> Directive[FontFamily -> "Helvetica", 20],
      Epilog -> {Red, Thick, Dashed,
      Line[{{#, 0}, {#, 1}} &@Last@Commonest[data]]}, PlotRange -> All,
      PlotRangePadding -> 0.001, AspectRatio -> 1, ImageSize -> 550]
Now I want to find the best possible probability distribution function (PDF). So let's try some of the most well-known PDFs:
1. Laplace distribution:
fit1 = FindDistributionParameters[Flatten@data, LaplaceDistribution[m, b]]
m0 = m /. fit1[[1]];
b0 = b /. fit1[[2]];
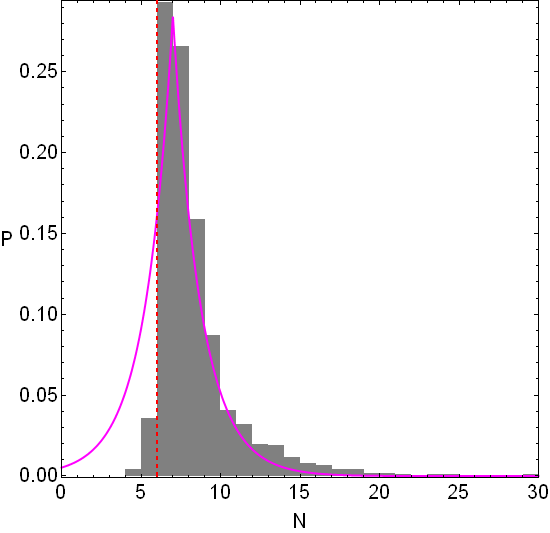
t1 = Plot[PDF[LaplaceDistribution[m0, b0], x], {x, 0, 30},
     PlotStyle -> {Magenta, Thick}, PlotRange -> All];
Show[{P00, t1}, Axes -> False]
As we can see, the right-hand side of the distribution is acceptable but the left-hand side is not.
2. Maxwell distribution:
fit2 = FindDistributionParameters[Flatten@data, MaxwellDistribution[m]]
m1 = m /. fit2[[1]];
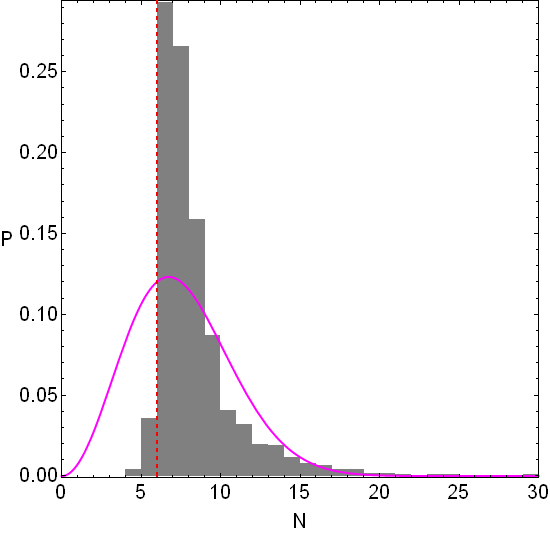
t2 = Plot[PDF[MaxwellDistribution[m1], x], {x, 0, 30}, PlotStyle -> {Magenta, Thick}];
Show[{P00, t2}, Axes -> False]
3. Reyleigh distribution:
fit3 = FindDistributionParameters[Flatten@data, RayleighDistribution[m]]
m2 = m /. fit3[[1]];
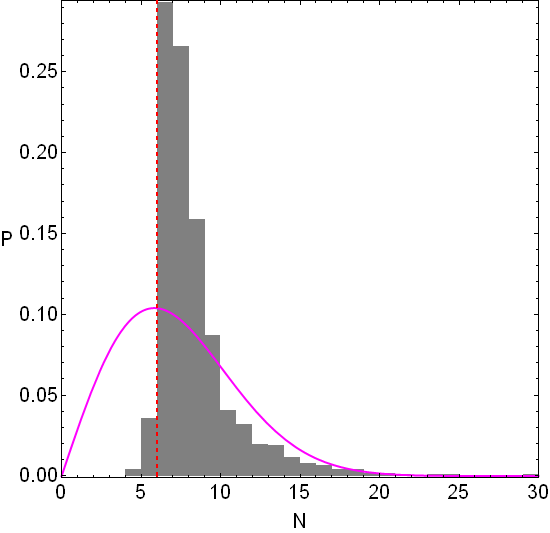
t3 = Plot[PDF[RayleighDistribution[m2], x], {x, 0, 30}, PlotStyle -> {Magenta, Thick}];
Show[{P00, t3}, Axes -> False]
We observe that the last two types of distribution do not fit well the data. In particular, they do not go high enough.
My question: Is there a way to fix/modify/improve these types of PDFs in order to achieve the best possible fit in my data? Moreover, is there any other type of PDF which might work better in this case?
Many thanks in advance!

FindDistribution? $\endgroup$