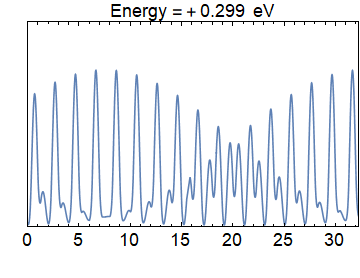
I have a plot generated from an ugly and complex set of piece-wise functions. I'm looking to extract the envelope function from this data set. I've tried a lot of suggestions in other threads, but none seem to contain information about dealing with piece-wise functions. I've tried using a Fourier series, but that didn't seem to give me what I was looking for. The plot is located below
$\begingroup$
$\endgroup$
2
-
1$\begingroup$ Can you provide the actual data? $\endgroup$– ktmCommented Nov 11, 2018 at 18:30
-
$\begingroup$ Try a MaxFilter with a window about 2 or 3 units wide to extract the upper envelope. MinFilter will get the lower envelope, though from the look of your graph, this may not be interesting. $\endgroup$– bill sCommented Nov 12, 2018 at 4:56
Add a comment
|
