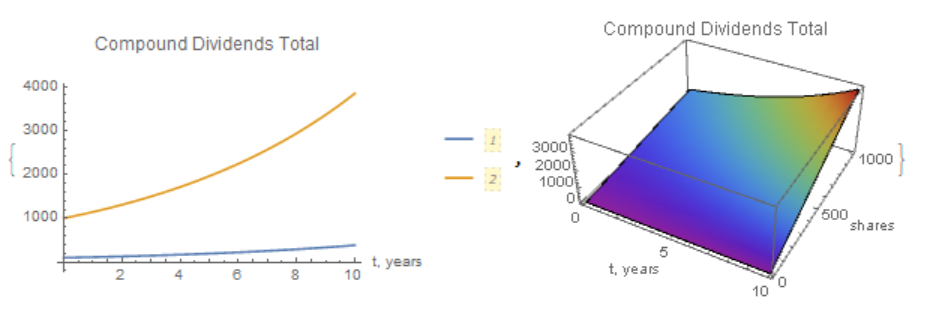
To preface, I'm very, very new to Mathematica. I've written a few functions to calculate compound dividends from stocks.
compoundDivsInterest[shares_, divyield_, years_, compoundrate_] :=
   ((shares (1 + (divyield/compoundrate))^(compoundrate*years) - shares))

compoundDivsTotal[shares_, divyield_, years_,compoundrate_] :=
   ((shares (1 + (compoundrate))^(compoundrate*years)))
TL;DR: I can't seem to get these functions to graph their correct exponential form. I've tried using a sum, using Show[Table[Plot[..., For[...Plot[..., and a "recursive" function. None have worked so far.
What should I do to get them to plot correctly?
As they are now, they will give the right value for a given x, but any other values are incorrect (as the function doesn't technically compound off the new principal). If I graph the functions, they are linear in nature.
A friend better versed in Mathematica than I suggested I use a sum to graph them.
Plot[Sum[compoundDivsTotal[x, 0.0659, 1, 4], {x, 1, n, 1}],{n, 0,1000}]
This does yield an exponential curve as would be expected, but none of the values are correct.
In order to plot the correct, exponential graph of compounded interest, I figured it would probably have to be done recursively or iteratively. I've tried many different ways from google, such as Show[Table[Plot[..., and For[...Plot[....
Finally, I tried doing the closest thing I could find to recursion, which was to re-implement the function as:
recCompoundDivsTotal[shares_,divyield_,years_,compoundrate_] :=
 recCompoundDivsTotal[shares] =
   ((shares (1 +(divyield/compoundrate))^(compoundrate * years)))
It gives the right value, but it's still linear in nature even though, from what I understand, it ought to recursively iterate using the previous value of shares
I'm at a loss for what to do. Any ideas?


divyield? $\endgroup$divyield=? $\endgroup$compoundDivsTotal[x, 0.0659, 1, 4]$\endgroup$compoundrate = 4? It's a lot. $\endgroup$