Perhaps you mean something like:
DensityPlot[
    x,
    {x,380,780},
    {y,0,1},
    ColorFunction->"Rainbow",
    AspectRatio->1/8,
    PlotRangePadding->None,
    FrameTicks->{
        {Charting`ScaledTicks[{Identity,Identity}, "TicksLength"->{-.01,-.005}],None},
        {Charting`ScaledTicks[{Identity,Identity}, "TicksLength"->{-.01,-.005}],None}
    }
]

where I used negative tick lengths.
Addendum
In my original answer, I basically used a negative number for the "positive" tick length. This is a problem because the tick label position only depends on the "negative" tick length. It would have been better to use the documented syntax:
$$\left\{\left\{x_1,\operatorname{label}_1,\left\{\operatorname{plen}_1,\operatorname{mlen}_1\right\}\right\},\ldots \right\}$$
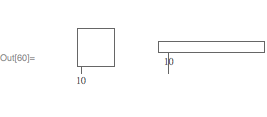
instead, i.e., {0, .01} instead of {-.01, 0}. In fact, using the documented syntax avoids the label/tick collision as long as the AspectRatio is 1. For example, compare:
GraphicsRow[{
    Graphics[
        {},
        PlotRange->{{0,100},{0,10}},
        AspectRatio->1,
        Frame->True,
        FrameTicks->{{None,None},{{{10, 10, {0, .2}}},None}}
    ],
    Graphics[
        {},
        PlotRange->{{0,100},{0,10}},
        Frame->True,
        FrameTicks->{{None,None},{{{10, 10, {0, .2}}},None}}
    ]
}]

Another possible approach to avoid the label/tick collision is to use a plot range that has an aspect ratio of 1:
GraphicsRow[{
    Graphics[
        {},
        PlotRange->{{380, 780}, {0, 400}},
        Frame -> True,
        FrameTicks -> {{None, None}, {{{400, 400, {0, .2}}}, None}},
        AspectRatio -> Full,
        ImageSize -> {300, 40}
    ],
    Graphics[
        {},
        PlotRange->{{380, 780}, {0, 400}},
        Frame -> True,
        FrameTicks -> {{None, None}, {{{400, 400, {0, .5}}}, None}},
        AspectRatio -> Full,
        ImageSize -> {300, 40}
    ]
}]

So, here's a function that leverages Charting`ScaledTicks, but adds support for custom tick lengths:
Options[customTicks] = Options[Charting`ScaledTicks];

customTicks[args__, opts:OptionsPattern[]][rng__] := Module[{major, minor},
    Internal`InheritedBlock[{Charting`ScaledTicks},
        Unprotect[Charting`ScaledTicks];
        SetOptions[Charting`ScaledTicks, "TicksLength"->{1, 2}];
        {major, minor} = Replace[
            OptionValue[customTicks, "TicksLength"],
            Except[{_, _}] :> {{.01, 0.}, {.005, 0.}}
        ];
        major = Replace[major,
            {
            t_?NumericQ :> {t, 0.},
            Except[{_, _}] :> {.01, 0.}
            }
        ];
        minor = Replace[minor,
            {
            t_?NumericQ :> {t, 0.},
            Except[{_, _}] :> {.005, 0.}
            }
        ];
        Replace[
            Charting`ScaledTicks[args, "TicksLength"->Automatic, opts][rng],
            {
                {a_, b_, {1, 0.}, c___} :> {a, b, major, c},
                {a_, b_, {2, 0.}, c___} :> {a, b, minor, c}
            },
            {1}
        ]
    ]
]
Using customTicks for your density plot:
GraphicsRow[{
    DensityPlot[
        x,
        {x,380,780},
        {y,0,400},
        PlotRangePadding->None,
        ColorFunction->"Rainbow",
        FrameTicks->{
            {None, None},
            {customTicks["Linear", "TicksLength"->{{0, .2}, {0, .1}}], None}
        },
        AspectRatio->Full,
        ImageSize->Automatic->{240, 30}
    ],
    DensityPlot[
        x,
        {x,380,780},
        {y,0,400},
        PlotRangePadding->None,
        ColorFunction->"Rainbow",
        FrameTicks->{
            {None, None},
            {customTicks["Linear", "TicksLength"->{{0, .4}, {0, .2}}], None}
        },
        AspectRatio->Full,
        ImageSize->Automatic->{240, 30}
    ]
}]

 Regarding the answer, by scaling the image I get this bad-looking effect...


Outseems not to be a valid options forFrameTicks, ad Mathematica gives me an error if i plug it in... $\endgroup$