6
$\begingroup$

I have a {x,f} data-set featuring multiple peaks. The peaks evolve with a second variable y. I would like to fit the multiple peaks with a multiple Gaussians or Lorentzians and track their position as the second variable y changes.

Sorry, I cannot figure a better way to share the example data

I am trying to fit it along these lines of the following two links.

How to perform a multi-peak fitting?

Fittting data with combination of an unknown number of Gaussians

Create a list of variables

kvar[k_Integer] := Through[{amp, pos, fwhm}[k]]

Without initial values, the fit does not converge

kvarCustom[k_Integer] := {{amp[k], 0.17}, {pos[k], 2*(k - 1) - 4055},{fwhm[k],1}}

List of parameters

param[n_Integer] := Flatten@Array[kvar, n]

And one with initial values

paramCustom[n_Integer]:=Flatten[Array[kvarCustom, n], 1]

Defining the Gaussian model

gaussian[amp_, pos_, fwhm_, x_] := amp*E^(-Log[2] ((x - pos)/(1/2 fwhm))^2)

gaussianModel[n_Integer] := Sum[gaussian[Sequence @@ kvar[i], x], {i, 1, n}]

fitGaussian[data_, minn_Integer, maxn_Integer, maxiter_Integer] := 
  MinimalBy[Table[{#, #["AIC"]} &@     
    NonlinearModelFit[data,gaussianModel[n],paramCustom[n], x,
      MaxIterations -> maxiter], {n, minn, maxn}], Last][[1, 1]]

Trying to fit data1 (or data2)

Show[ListPlot[data1, PlotStyle -> Red, PlotRange -> All], 
Plot[Evaluate[Normal[fitGaussian[data1, 9, 10, 10000]]], {x, -4060, -4030}, PlotStyle -> Black, PlotRange -> All]]

does not yield the desired result.

I know this is not the most efficient way to do it. And evidently, it also does not work properly. I would appreciate any kind of advice or help in improving the fit.

Thanks, Sole

$\endgroup$
6
  • $\begingroup$ The function cutSlowAxis is not defined in the question. $\endgroup$ Commented Jun 25, 2018 at 2:10
  • $\begingroup$ Sorry, that's a function that I used to get data1 and data2. I replaced it. $\endgroup$
    – sole
    Commented Jun 25, 2018 at 7:29
  • $\begingroup$ Please clarify this: "[...] track their position as the second variable y changes." I assume you want to find for correspondence between values of y and peak locations. $\endgroup$ Commented Jun 25, 2018 at 10:24
  • 1
    $\begingroup$ What about using a few sinusoids? If I take Fourier and zero all but the largest components, the result of InverseFourier is still a fairly good approximation. $\endgroup$ Commented Jun 28, 2018 at 23:11
  • 1
    $\begingroup$ @Antonx3 Done.. $\endgroup$ Commented Jun 29, 2018 at 14:33

3 Answers 3

8
$\begingroup$

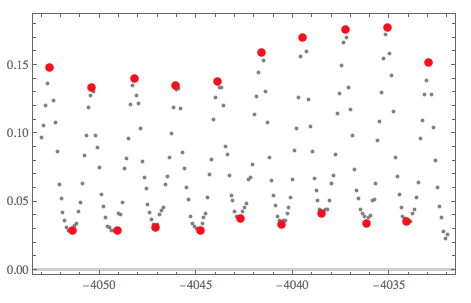
This solution should address OP's computational problems. It uses "localized" fitting of Gaussians.

Procedure outline

  1. Find local extrema with this package as described here.

  2. Make a list of Gaussian basis functions regularly spaced in the range of data's x-coordinates.

  3. Add to the local minima the minimum and maximum x-coordinates; sort; partition the extended local minima in pairs.

  4. For each pair p of step 3:

    1. Find the data subset that is within p.

    2. Find the subset of the basis functions that is within p.

    3. Do a Quantile Regression fit over the data subset with the basis functions subset.

  5. Plot the data and the found fit functions.

Code

Import["https://raw.githubusercontent.com/antononcube/\
MathematicaForPrediction/master/Applications/\
QuantileRegressionForLocalExtrema.m"]

Assign data of interest to the variable data:

data = data1;

{qfuncs, extrema} = 
 QRFindExtrema[data, 20, 2, 12]; ListPlot[{data, Sequence @@ extrema},
  PlotRange -> All, 
 PlotStyle -> {Gray, {PointSize[0.02], Red}, {PointSize[0.02], Red}}] 

enter image description here

gaussian[amp, pos, fwhm, x]

(* 2^(-((4 (-pos + x)^2)/fwhm^2)) amp *)

aBFuncs = 
  Association[
   Flatten@Table[
     pos -> gaussian[amp, pos, fwhm, x], {amp, {1}}, {pos, 
      Min[data[[All, 1]]], Max[data[[All, 1]]], 0.5}, {fwhm, {1}}]];
Length[aBFuncs]

(* 43 *)

Quiet[Plot[Evaluate[RandomSample[Values[aBFuncs], 20]],
  {x, Min[data[[All, 1]]], Max[data[[All, 1]]]}, PlotRange -> All, 
  PlotTheme -> "Scientific"]]

enter image description here

fitFuncs = 
Map[
  Function[{p}, 
   QuantileRegressionFit[
     Select[data, p[[1]] <= #[[1]] <= p[[2]] &], 
     Values@KeySelect[aBFuncs, p[[1]] <= # <= p[[2]] &],
     x, {0.99}][[1]]
  ],
  Partition[Sort@Join[MinMax[data[[All, 1]]], extrema[[1, All, 1]]], 2, 1]
]

(* {0. + 0.0250952 2^(-4 (4051.5 + x)^2) + 
  0.130248 2^(-4 (4052.5 + x)^2) + 0.0324874 2^(-4 (4053. + x)^2), 
 0. + 0.0442749 2^(-4 (4049.5 + x)^2) + 
  0.130753 2^(-4 (4050.5 + x)^2) + 0.0235966 2^(-4 (4051. + x)^2), 
 0. + 0.0341665 2^(-4 (4047.5 + x)^2) + 
  0.0834918 2^(-4 (4048. + x)^2) + 0.0725393 2^(-4 (4048.5 + x)^2), 
 0. + 0.0300027 2^(-4 (4045. + x)^2) + 
  0.134351 2^(-4 (4046. + x)^2) + 0.000904596 2^(-4 (4046.5 + x)^2) + 
  0.0267868 2^(-4 (4047. + x)^2), 
 0.0369149 2^(-4 (4043. + x)^2) + 0.0494263 2^(-4 (4043.5 + x)^2) + 
  0.0993366 2^(-4 (4044. + x)^2) + 0.0154357 2^(-4 (4044.5 + x)^2), 
 0.0289263 2^(-4 (4041. + x)^2) + 0.140271 2^(-4 (4041.5 + x)^2) + 
  0.0257861 2^(-4 (4042. + x)^2) + 0.0322191 2^(-4 (4042.5 + x)^2), 
 0. + 0.0251923 2^(-4 (4038.5 + x)^2) + 
  0.0124079 2^(-4 (4039. + x)^2) + 0.162526 2^(-4 (4039.5 + x)^2) + 
  0.0286207 2^(-4 (4040.5 + x)^2), 
 0. + 0.0282391 2^(-4 (4036.5 + x)^2) + 
  0.0647279 2^(-4 (4037. + x)^2) + 0.134648 2^(-4 (4037.5 + x)^2) + 
  0.0330122 2^(-4 (4038.5 + x)^2), 
 0.0271103 2^(-4 (4034.5 + x)^2) + 0.168334 2^(-4 (4035. + x)^2) + 
  0.0122921 2^(-4 (4035.5 + x)^2) + 0.0312246 2^(-4 (4036. + x)^2), 
 0. + 0.0166107 2^(-4 (4032. + x)^2) + 0.15326 2^(-4 (4033. + x)^2) + 
  0.030759 2^(-4 (4034. + x)^2)} *)


Quiet[Show[{ListPlot[data, PlotRange -> All, 
    PlotTheme -> "Scientific"], 
   Plot[fitFuncs, {x, Min[data[[All, 1]]], Max[data[[All, 1]]]}, 
    PlotRange -> All]}]]

enter image description here

Results of the code above with data2

enter image description here

enter image description here

$\endgroup$
2
  • $\begingroup$ This is amazing! Thank you very much. $\endgroup$
    – sole
    Commented Jun 29, 2018 at 8:02
  • $\begingroup$ Great, good luck! $\endgroup$ Commented Jun 29, 2018 at 11:07
5
$\begingroup$

(A partial answer, I am looking for clarifications from OP.)

This is what I asked in a comment:

Please clarify this: "[...] track their position as the second variable y changes." I assume you want to find for correspondence between values of y and peak locations.

I managed to produce these Gaussian functions to fit the peaks:

enter image description here

Is this what are you looking for?

Procedure outline

  1. Get original estimates with NonlinearModelFit.

  2. With the estimates come up with a list of Gaussian basis functions.

  3. Do a Quantile Regression fit over the data with the basis functions.

  4. Find the zeroes of the derivative of the obtained fit.

  5. Extract functions from the fit (or basis) that correspond to the found zeroes. (These are -- I think -- the "tracking functions".)

  6. Plot data and "tracking functions".

Code

Step 1

Block[{n = 10},
 nlm = NonlinearModelFit[data1, gaussianModel[n], paramCustom[n], x, 
    MaxIterations -> 100];
 ]

During evaluation of In[42]:= NonlinearModelFit::cvmit: Failed to converge to the requested accuracy or precision within 100 iterations.

nlm["BestFitParameters"]

(* {amp[1] -> 4.20359*10^6, pos[1] -> -4.63219*10^6, 
 fwhm[1] -> 1.20698*10^6, amp[2] -> -1.98083, pos[2] -> -4051.58, 
 fwhm[2] -> 1.66105, amp[3] -> 1.99385, pos[3] -> -4051.59, 
 fwhm[3] -> 1.79773, amp[4] -> -0.303338, pos[4] -> -4046.96, 
 fwhm[4] -> 1.45688, amp[5] -> 3.9729, pos[5] -> -4044.96, 
 fwhm[5] -> 3.4242, amp[6] -> -3.95633, pos[6] -> -4044.94, 
 fwhm[6] -> 3.08963, amp[7] -> -1.63934, pos[7] -> -4042.85, 
 fwhm[7] -> 0.969391, amp[8] -> 1.39524, pos[8] -> -4042.85, 
 fwhm[8] -> 0.896722, amp[9] -> 0.125191, pos[9] -> -4039.46, 
 fwhm[9] -> 0.638465, amp[10] -> 0.0956902, pos[10] -> -4035.43, 
 fwhm[10] -> 7.75519} *)

Below see that amp and fwhm chosen to be constants. Quantile regression does not need amp and having fwhm to be Range[0.8,3,0.2] did not make the results different. (It just made the computations slower.)

Step 2

gaussian[amp, pos, fwhm, x]

(* 2^(-((4 (-pos + x)^2)/fwhm^2)) amp *)


bfuncs = Flatten@
   Table[gaussian[amp, pos, fwhm, x], {amp, {1}}, {pos, -4060, -4025, 
     0.5}, {fwhm, {1}}];
Length[bfuncs]

(* 71 *)

enter image description here

Step 3

Import["https://raw.githubusercontent.com/antononcube/MathematicaForPrediction/master/QuantileRegression.m"]
f = QuantileRegressionFit[data1, bfuncs, x, {0.99}][[1]];

enter image description here

Step 4

(* Too slow *)
(*Reduce[D[f,x]\[Equal]0,{x}]*)    
(* $Aborted *)

posPeaks = Union[
   Flatten[Position[data1[[All, 2]], #] & /@ 
     TakeLargest[data1[[All, 2]], 40]]];

df = D[f, x];
xPeaks = Quiet[
  Union[x /. FindRoot[df == 0, {x, data1[[#, 1]]}] & /@ posPeaks, 
   SameTest -> (Norm[#1 - #2] < 10^-4 &)]]

(* {-4052.56, -4050.41, -4048.15, -4046.02, -4043.84, -4041.64, -4039.48, -4037.34, -4035.08, -4033.01} *)

Differences[xPeaks]

(* {2.1465, 2.25513, 2.13475, 2.17485, 2.20561, 2.16207, 2.13189, 2.26507, 2.07208} *)

Step 5

fTerms = List @@ f;
Quiet[
 fPeaks =
  Map[# -> (t = fTerms /. x -> #; 
      Plus @@ Pick[fTerms, # > 10^-4 & /@ t]) &,
   xPeaks
 ]]

Step 6

Quiet@Show[{
  Plot[Evaluate@Values[fPeaks], {x, -4055, -4030}, PlotRange -> All],
  ListPlot[data1, PlotRange -> All, PlotStyle -> Red]
}]

(* Resulting image shown at the beginning of this post *)
$\endgroup$
15
  • $\begingroup$ Anton, Thank you for the elaborate and very useful answer. The variable y, is a variable, which changes the list from data1 to data2. So actually instead of a single list, I have a matrix, and I want to apply the peak analysis for each of the row in the matrix. I tried reproducing your suggested procedure. In Step1 the fit does not converge, and the amp and fwhm that I get are not constant. In Step3, evaluating f takes longer than 5 minutes. Am I doing something wrong? I would have to confirm this, but the rest should be relatively straight-forward. Thanks $\endgroup$
    – sole
    Commented Jun 25, 2018 at 17:46
  • $\begingroup$ @sole I used the wrong data for step 1. (In my post only, BTW.) That step is not that important, just informative. See my new computations and comments... $\endgroup$ Commented Jun 25, 2018 at 19:54
  • $\begingroup$ Thanks. Now the first step looks the same. In the third step I got f = QuantileRegressionFit[data2, bfuncs, x, {0.99}][[1]]; LinearProgramming::lpipncv: The interior point algorithm cannot converge to the tolerance of 1.4901161193847656*^-8. The best residual achieved is 0.01908082696781698. The failure to converge might be because the problem is mildly infeasible. Setting the option Method -> RevisedSimplex should give a more definite answer, though large problems may take longer computing time. $\endgroup$
    – sole
    Commented Jun 25, 2018 at 21:53
  • $\begingroup$ @sole Use smaller tolerance. I think in your case 10^-3 or 10^-2 should suffice. You can also change the method of QuantileRegression. On my computer with version 11.3 I get f = QuantileRegressionFit[data2, bfuncs, x, {0.99}][[1]]; to finish within 1/3 second. What Mathematica version are you using? Is your data2 the same as the one you posted or it is a larger dataset? $\endgroup$ Commented Jun 25, 2018 at 23:27
  • $\begingroup$ @sole Here is how you can specify tolerance: f = QuantileRegressionFit[data2, bfuncs, x, {0.99}, Method -> {LinearProgramming, Tolerance -> 10^(-2)}][[1]] $\endgroup$ Commented Jun 25, 2018 at 23:30
4
$\begingroup$

It might make sense to use a few sinusoids instead of e.g. Gaussians. While there are very likely better ways to go about this using windowing, I show a naive approach where we simply clip frequencies that do not have large amplitudes.

data = {{-4053, 0.0970776}, {-4052.9, 0.105458}, {-4052.8, 
    0.120125}, {-4052.7, 0.136886}, {-4052.6, 0.14841}, {-4052.5, 
    0.14806}, {-4052.4, 0.123966}, {-4052.3, 0.107903}, {-4052.2, 
    0.0869506}, {-4052.1, 0.0625067}, {-4052, 0.0523801}, {-4051.9, 
    0.042253}, {-4051.8, 0.0359675}, {-4051.7, 0.0314279}, {-4051.6, 
    0.0293327}, {-4051.5, 0.0296819}, {-4051.4, 0.0289835}, {-4051.3, 
    0.0324755}, {-4051.2, 0.0338723}, {-4051.1, 0.0426022}, {-4051, 
    0.049237}, {-4050.9, 0.0635543}, {-4050.8, 0.0841568}, {-4050.7, 
    0.0984741}, {-4050.6, 0.118728}, {-4050.5, 0.127457}, {-4050.4, 
    0.133743}, {-4050.3, 0.1306}, {-4050.2, 0.0981248}, {-4050.1, 
    0.0893951}, {-4050, 0.0747286}, {-4049.9, 0.0555226}, {-4049.8, 
    0.0464437}, {-4049.7, 0.0384118}, {-4049.6, 0.0321263}, {-4049.5, 
    0.0310787}, {-4049.4, 0.0293327}, {-4049.3, 0.0293327}, {-4049.2, 
    0.0293327}, {-4049.1, 0.0289835}, {-4049, 0.0415546}, {-4048.9, 
    0.0408562}, {-4048.8, 0.0495863}, {-4048.7, 0.0740302}, {-4048.6, 
    0.0813634}, {-4048.5, 0.0963792}, {-4048.4, 0.120823}, {-4048.3, 
    0.13514}, {-4048.2, 0.140029}, {-4048.1, 0.127807}, {-4048, 
    0.12222}, {-4047.9, 0.103712}, {-4047.8, 0.0796173}, {-4047.7, 
    0.0677446}, {-4047.6, 0.0593636}, {-4047.5, 0.0478401}, {-4047.4, 
    0.0419038}, {-4047.3, 0.0366659}, {-4047.2, 0.0331739}, {-4047.1, 
    0.0310787}, {-4047, 0.0335231}, {-4046.9, 0.0408562}, {-4046.8, 
    0.0433006}, {-4046.7, 0.0457451}, {-4046.6, 0.0625067}, {-4046.5, 
    0.068443}, {-4046.4, 0.0820619}, {-4046.3, 0.099871}, {-4046.2, 
    0.119077}, {-4046.1, 0.13514}, {-4046, 0.131997}, {-4045.9, 
    0.132695}, {-4045.8, 0.118029}, {-4045.7, 0.0859029}, {-4045.6, 
    0.0740302}, {-4045.5, 0.0604113}, {-4045.4, 0.0516816}, {-4045.3, 
    0.0394594}, {-4045.2, 0.0342215}, {-4045.1, 0.0321263}, {-4045, 
    0.0307295}, {-4044.9, 0.0303803}, {-4044.8, 0.0293327}, {-4044.7, 
    0.0338723}, {-4044.6, 0.0384118}, {-4044.5, 0.0412054}, {-4044.4, 
    0.0534273}, {-4044.3, 0.0698399}, {-4044.2, 0.0810142}, {-4044.1, 
    0.109998}, {-4044, 0.126061}, {-4043.9, 0.137934}, {-4043.8, 
    0.133394}, {-4043.7, 0.133743}, {-4043.6, 0.120125}, {-4043.5, 
    0.0900936}, {-4043.4, 0.084506}, {-4043.3, 0.0691415}, {-4043.2, 
    0.0548242}, {-4043.1, 0.0506339}, {-4043, 0.0429514}, {-4042.9, 
    0.0391102}, {-4042.8, 0.0384118}, {-4042.7, 0.0380627}, {-4042.6, 
    0.0426022}, {-4042.5, 0.0457451}, {-4042.4, 0.0488878}, {-4042.3, 
    0.0663477}, {-4042.2, 0.0673953}, {-4042.1, 0.0771727}, {-4042, 
    0.113839}, {-4041.9, 0.126759}, {-4041.8, 0.144568}, {-4041.7, 
    0.158536}, {-4041.6, 0.159235}, {-4041.5, 0.153298}, {-4041.4, 
    0.13095}, {-4041.3, 0.108252}, {-4041.2, 0.0824106}, {-4041.1, 
    0.0653}, {-4041, 0.0548242}, {-4040.9, 0.0471421}, {-4040.8, 
    0.0394594}, {-4040.7, 0.0363167}, {-4040.6, 0.0335231}, {-4040.5, 
    0.0359675}, {-4040.4, 0.0359675}, {-4040.3, 0.0412054}, {-4040.2, 
    0.0457451}, {-4040.1, 0.0534273}, {-4040, 0.0663477}, {-4039.9, 
    0.0872998}, {-4039.8, 0.103712}, {-4039.7, 0.12641}, {-4039.6, 
    0.156092}, {-4039.5, 0.17006}, {-4039.4, 0.16971}, {-4039.3, 
    0.159933}, {-4039.2, 0.124664}, {-4039.1, 0.10476}, {-4039, 
    0.0869506}, {-4038.9, 0.0670461}, {-4038.8, 0.0579672}, {-4038.7, 
    0.0506339}, {-4038.6, 0.0446976}, {-4038.5, 0.0415546}, {-4038.4, 
    0.0429514}, {-4038.3, 0.0443482}, {-4038.2, 0.0443482}, {-4038.1, 
    0.0506339}, {-4038, 0.0635543}, {-4037.9, 0.0691415}, {-4037.8, 
    0.084506}, {-4037.7, 0.114887}, {-4037.6, 0.128854}, {-4037.5, 
    0.149806}, {-4037.4, 0.166568}, {-4037.3, 0.176345}, {-4037.2, 
    0.170409}, {-4037.1, 0.133394}, {-4037, 0.11768}, {-4036.9, 
    0.0981248}, {-4036.8, 0.0733317}, {-4036.7, 0.0579672}, {-4036.6, 
    0.0520308}, {-4036.5, 0.043999}, {-4036.4, 0.0412054}, {-4036.3, 
    0.0391102}, {-4036.2, 0.0342215}, {-4036.1, 0.0387611}, {-4036, 
    0.0398087}, {-4035.9, 0.0509832}, {-4035.8, 0.0516816}, {-4035.7, 
    0.0632051}, {-4035.6, 0.0949823}, {-4035.5, 0.108601}, {-4035.4, 
    0.129902}, {-4035.3, 0.154695}, {-4035.2, 0.172504}, {-4035.1, 
    0.177742}, {-4035, 0.158536}, {-4034.9, 0.142473}, {-4034.8, 
    0.115934}, {-4034.7, 0.0820619}, {-4034.6, 0.068443}, {-4034.5, 
    0.0555226}, {-4034.4, 0.0457451}, {-4034.3, 0.0391102}, {-4034.2, 
    0.0377134}, {-4034.1, 0.0352691}, {-4034, 0.0363167}, {-4033.9, 
    0.0356183}, {-4033.8, 0.0415546}, {-4033.7, 0.043999}, {-4033.6, 
    0.0530785}, {-4033.5, 0.0642528}, {-4033.4, 0.0960299}, {-4033.3, 
    0.109648}, {-4033.2, 0.128156}, {-4033.1, 0.138981}, {-4033, 
    0.152251}, {-4032.9, 0.151901}, {-4032.8, 0.128505}, {-4032.7, 
    0.10441}, {-4032.6, 0.0799665}, {-4032.5, 0.0604113}, {-4032.4, 
    0.0467929}, {-4032.3, 0.0384118}, {-4032.2, 0.0279359}, {-4032.1, 
    0.0233964}, {-4032, 0.0261899}};

ft = Fourier[data[[All, 2]]];

Lets see what the spectrum looks like in terms of magnitudes.

ListPlot[Abs[ft]]

enter image description here

We'll clip at magnitude 0.05.

clipped = ft /. (aa_ /; Abs[aa] <= .05 :> 0);
ListPlot[Abs[clipped]]

enter image description here

Now take the inverse FT of the clipped FT to get the low dimensional (in terms of number of frequencies) approximation.

approx = Re[InverseFourier[clipped]];

We superimpose list plots to check by eye that this gave a reasonable approximation.

ListPlot[{approx, data[[All, 2]]}]

enter image description here

$\endgroup$

Your Answer

By clicking “Post Your Answer”, you agree to our terms of service and acknowledge you have read our privacy policy.

Not the answer you're looking for? Browse other questions tagged or ask your own question.