0
$\begingroup$

I have data that I would like to fit with Bessel function https://www.dropbox.com/s/7se9mb2epbietng/data.dat?dl=0

cylinder=NonlinearModelFit[data,(k1/q)*(BesselJ[1, q*r1]/(q*r1))^2 , {k1,  r1},q, MaxIterations -> 10000] // (sol = #) &;
fitPoints = cylinder[Q] /. sol[[1]][[2]] // Table[{Q, #}, {Q, data[[All, 1]]}] & // (cylRes = #) &;

ListLogLogPlot[{data, fitPoints}, PlotRange -> All]

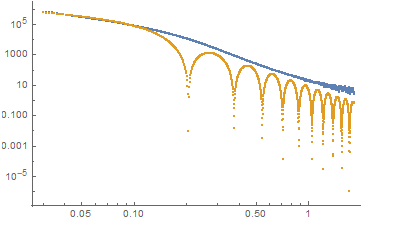
enter image description here

data in blue, fit mapped on data[[All,1]] in orange Log/Log view

how can I fit it so that $ r_1 $ has a Gaussian distribution which would smoothen the minima? I was thinking about maybe summing up 100 Bessels with $ r_1 $ confined somehow with Gaussian, but I have no idea how to proceed.

$\endgroup$

1 Answer 1

1
$\begingroup$

I was thinking about maybe summing up 100 Bessels with r1 confined somehow with Gaussian, but I have no idea how to proceed.
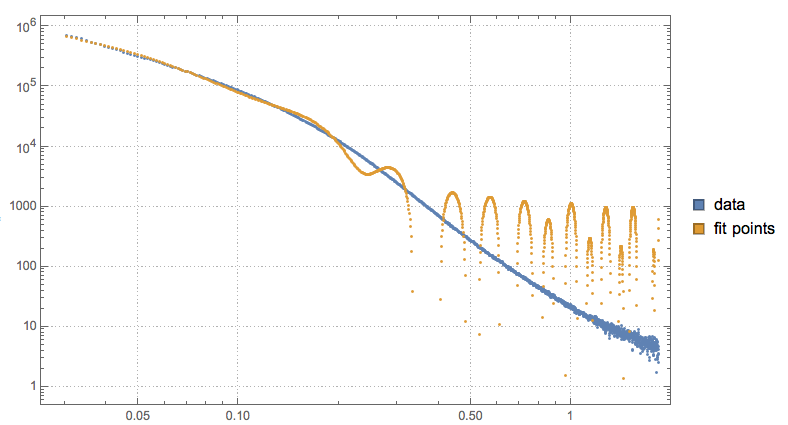
Solutions using Quantile Regression are described in several MSE answers. See for example, Multi-peak fitting for peak position.

Using NonLinearModelFit you can do something like the following, that requires adjusting the basis functions.

bFuncs = Flatten@
   Table[(k1/q)*(BesselJ[1, q*r1]/(q*r1))^2, {k1, {84871}}, {r1, 16, 
     20, 0.1}];
Length[bFuncs]

(* 41 *)

coeffs = Array[c, Length[bFuncs]];

nlm = NonlinearModelFit[data, bFuncs.coeffs, coeffs, q];

nlm["BestFitParameters"]

(* {c[1] -> 9.61732*10^8, c[2] -> -5.25827*10^9, ... *)

qFuncExpr = FullSimplify[nlm["Function"][x]]

ListLogLogPlot[{data, {#, qFuncExpr /. x -> #} & /@ data[[All, 1]]}, PlotRange -> All, PlotTheme -> "Detailed", PlotLegends -> SwatchLegend[{"data", "fit points"}]]

enter image description here

$\endgroup$

Your Answer

By clicking “Post Your Answer”, you agree to our terms of service and acknowledge you have read our privacy policy.

Not the answer you're looking for? Browse other questions tagged or ask your own question.