4
$\begingroup$

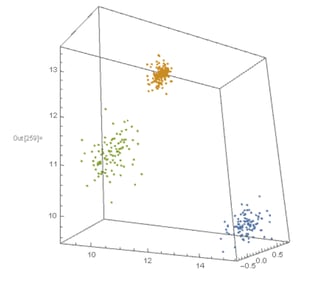
I am trying to plot the points of virus outbreak along time of 3 areas. I already have the data1, which have 3 columns: x-coordinate, y-coordinate and time. Then I have a 3D plot as below:-

ListPointPlot3D[data1]

The plot of virus outbreak enter image description here

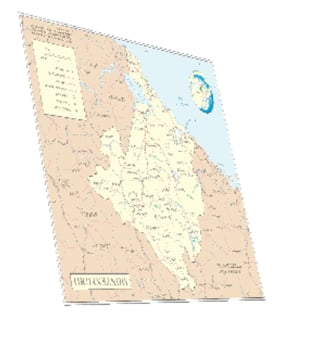
I have an image of the map of the area concerned, and want to attach it to the bottom of the box for better illustration, is there a way to do this?

Many thanks!

$\endgroup$

1 Answer 1

5
$\begingroup$

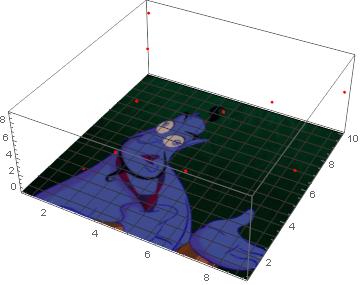
you can combine 2 graphics with show[]. since you didn't provide neither the data nor the image required I used a meme I had saved as an example

data = RandomInteger[{0, 10}, {10, 3}];

Show[{ ListPointPlot3D[data, PlotStyle -> {Red}]  , 
  Plot3D[0, {x, 0, 10}, {y, 0, 10}, 
   PlotRange -> {{0, 10}, {0, 10}, {0, 10}}, PlotStyle -> Texture[ yourfile.jpg    ]]}]

enter image description here

$\endgroup$
2
  • $\begingroup$ Thanks for your reply and it really helps. May I also ask how can I raise up the image from z=0 to z=5? I tried to assign pts = {{0, 0, 5}, {0, 10, 5}, {10, 10, 5}, {10, 0, 5}}; and then run Show[{ListPointPlot3D[data, PlotStyle -> {Red}], Plot3D[0, {x, 0, 10}, {y, 0, 10}, PlotRange -> {{0, 10}, {0, 10}, {0, 10}}, PlotStyle -> {Texture[yourfile.jpg], Polygon[pts, VertexTextureCoordinates -> pts]}]}], but it doesn't do anything. $\endgroup$
    – H42
    Commented Jun 12, 2018 at 2:36
  • $\begingroup$ @HMC to raise the image you must change the value 0 to 5 in Plot3D. In addition, if you want to remove the gridlines simply add Mesh-> None as an option at the end of Plot3D after a comma $\endgroup$
    – Alucard
    Commented Jun 12, 2018 at 3:21

Your Answer

By clicking “Post Your Answer”, you agree to our terms of service and acknowledge you have read our privacy policy.

Not the answer you're looking for? Browse other questions tagged or ask your own question.