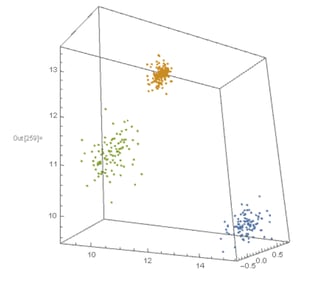
I am trying to plot the points of virus outbreak along time of 3 areas. I already have the data1, which have 3 columns: x-coordinate, y-coordinate and time. Then I have a 3D plot as below:-
ListPointPlot3D[data1]
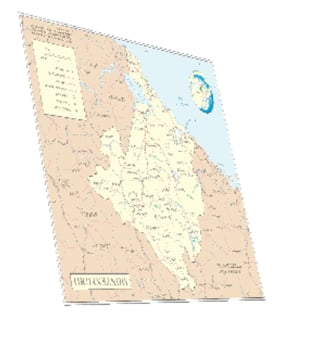
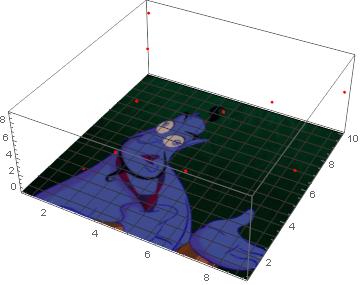
I have an image of the map of the area concerned, and want to attach it to the bottom of the box for better illustration, is there a way to do this?
Many thanks!


