1
$\begingroup$

I am trying to represent the domain of a function whose domain is represented by x^3 - y^5 > 0. To do so, I am using RegionPlot.

I have managed to get something not too bad, but I'm running into issues:

  1. I would like to label the axes instead of the frame with the numbers, but I can't figure out how to do so. I managed to make the numbers on the frame dissapear but not make the ones on the axes appear;

  2. I would like my plot label to be closer to the figure, but any optional argument I add to PlotLabel, other than the name I want it to have, doesn't work. For example, I tried

    PlotLabel -> Placed[Automatic, Above]
    

    and it literally wrote Placed[Automatic, Above]

I'm relatively new to this so maybe there is something obvious I am missing?

Here my code

RegionPlot[
  x^3 - y^5 > 0, {x, -20, 20}, {y, -8, 8},
  AxesLabel -> {x, y}, 
  BoundaryStyle -> Dashed,
  PlotRangePadding -> None,
  Axes->True,
  PlotLabel-> "x^3-y^5>0", 
  FrameTicks -> None,
  Ticks->Automatic]

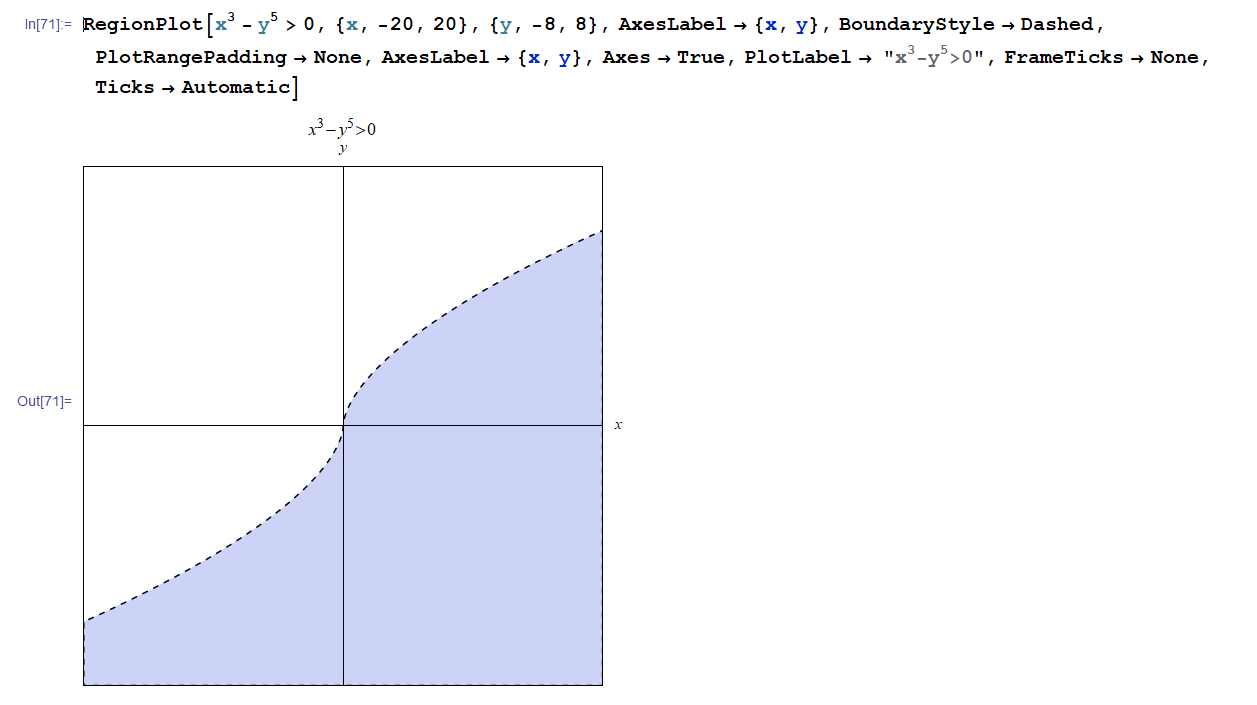
and here is what I see in my Mathematica notebook.

enter image description here

$\endgroup$
1

2 Answers 2

2
$\begingroup$

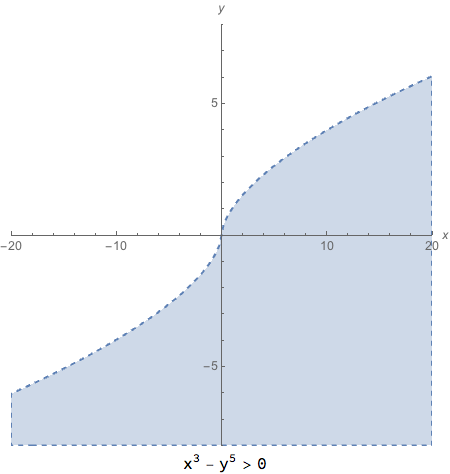
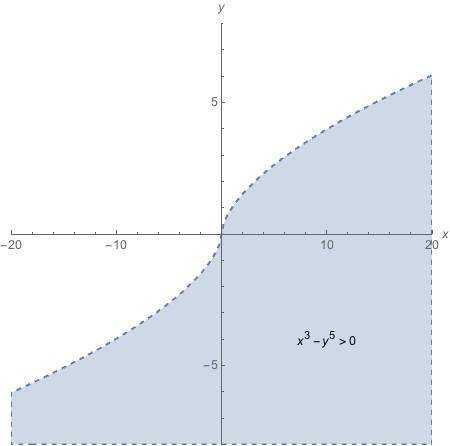
Here are two ways you might modify your code. Both get rid of the frame with Frame -> None. The 1st uses Labled to place the plot label, and the 2nd uses text displayed by an Epilog option to do the placing.

Labeled[
  RegionPlot[
    x^3 - y^5 > 0, {x, -20, 20}, {y, -8, 8},
    Frame -> None,
    Axes -> True,
    AxesLabel -> {x, y},
    BoundaryStyle -> Dashed,
    PlotRangePadding -> None],
  x^3 - y^5 > 0,
  Bottom]

plot1

RegionPlot[
  x^3 - y^5 > 0, {x, -20, 20}, {y, -8, 8},
  Frame -> None,
  Axes -> True,
  AxesLabel -> {x, y},
  BoundaryStyle -> Dashed,
  PlotRangePadding -> None,
  Epilog -> {Text[x^3 - y^5 > 0, Scaled[{.75, .25}]]}]

plot2

$\endgroup$
1
$\begingroup$

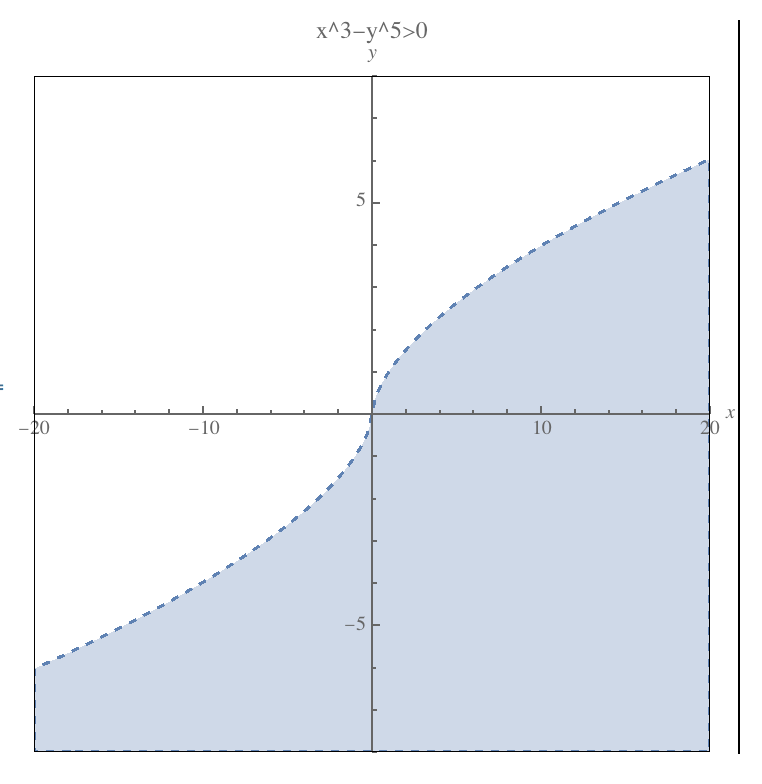
You could use an Epilog to create the Frame instead, e.g.:

RegionPlot[
    x^3-y^5>0,
    {x,-20,20},
    {y,-8,8},
    AxesLabel->{x,y},
    BoundaryStyle->Dashed,
    PlotRangePadding->None,
    Axes->True,
    Frame->False,
    PlotLabel->"x^3-y^5>0",
    Epilog->{
        FaceForm[None],
        EdgeForm[Black], 
        Rectangle[Scaled[{0,0}],Scaled[{1,1}]]
    }
]

enter image description here

Where exactly do you want the plot label to go? It seems that it's already very close to the $y$ axis label.

$\endgroup$

Your Answer

By clicking “Post Your Answer”, you agree to our terms of service and acknowledge you have read our privacy policy.

Not the answer you're looking for? Browse other questions tagged or ask your own question.