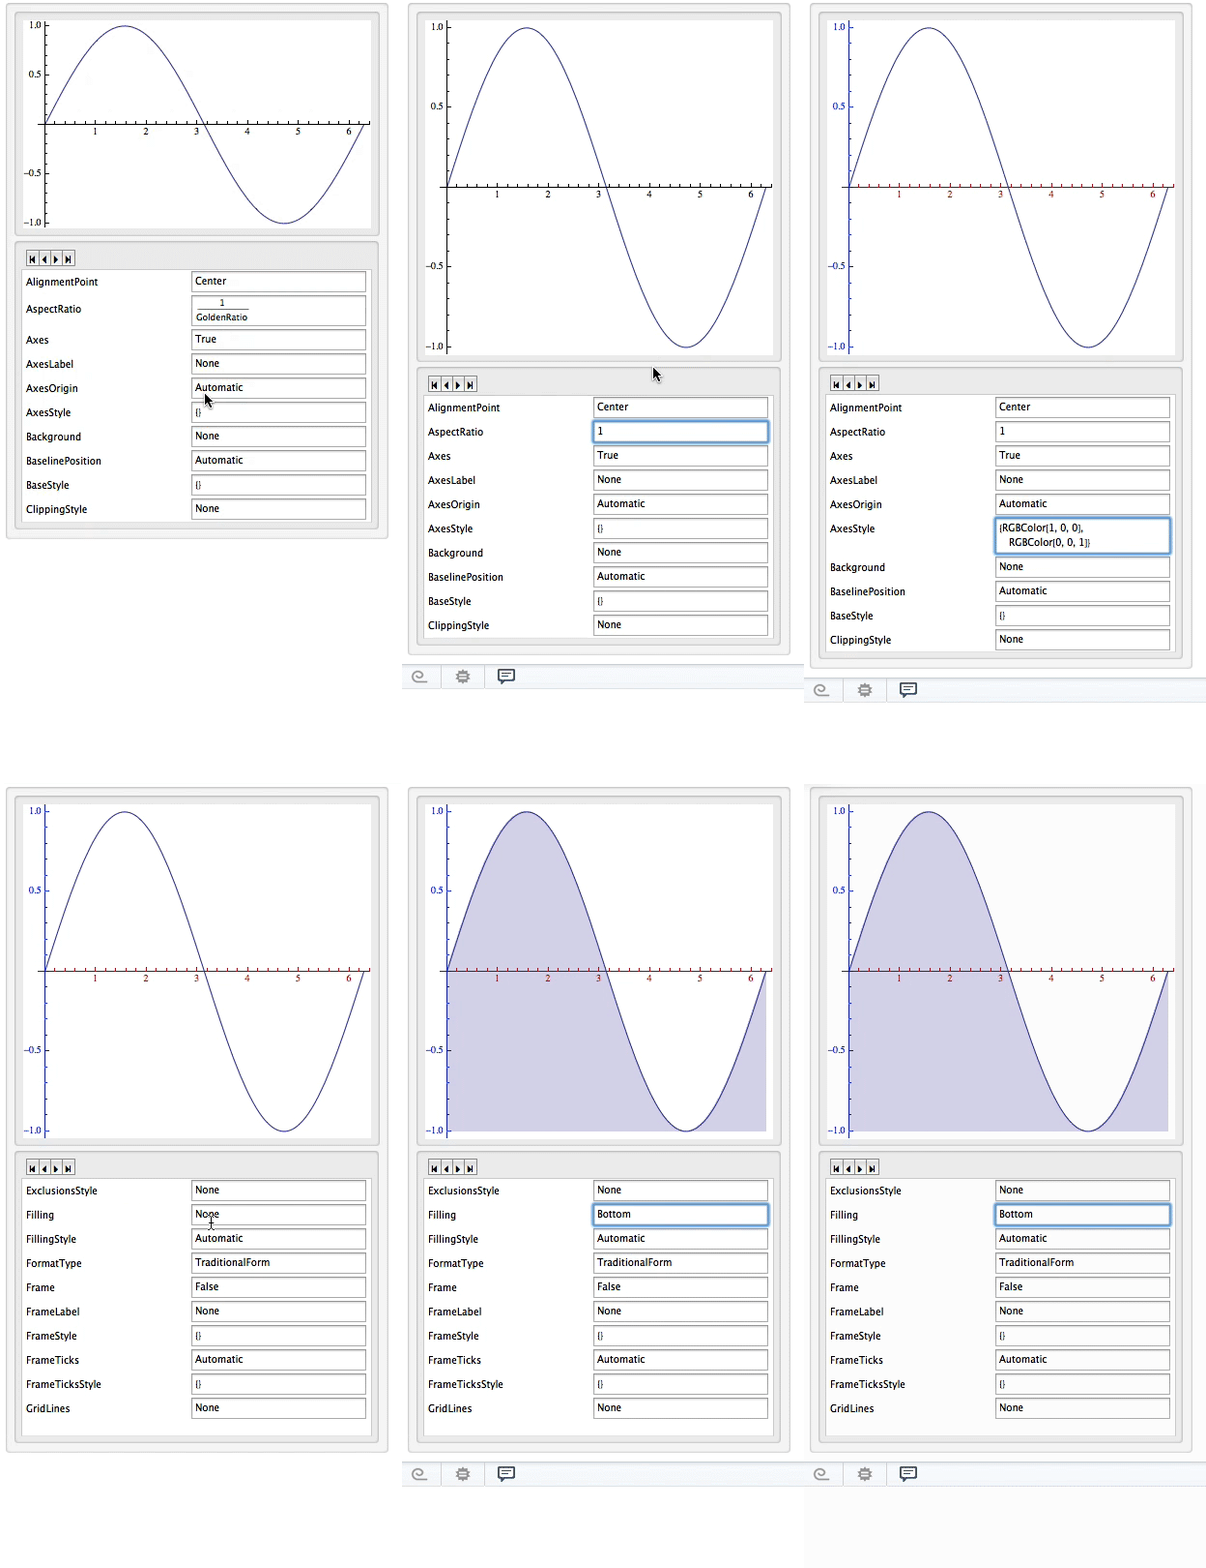
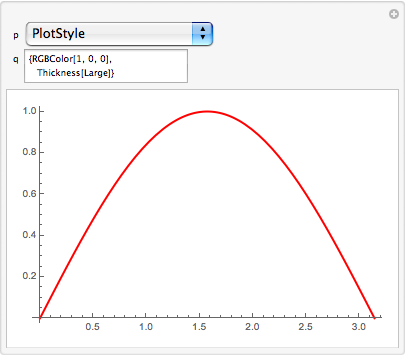
I am trying to make a series of changes in the appearance of the Plot of some function. I am trying to use Manipulate for my experiments. I tried to change the following code
Manipulate[
 Plot[Sin[x], {x, 0, Pi}], {p, HoldForm /@ Options[Plot]}, {q,
  InputField}]
so that when, for example, p is AxesOrigin ->Automatic and q is changed to {-3,5} then the plot will be updated with Axes Origin at {-3,5}. Similar if p is taken AxesLabeL->None and p is changed to "A label" then the last plot will refreshed showing the label "A label" at the top(without affecting any changes already made in other options like AxesOrigin above).


Manipulate[With[{p1=p[[1,1]]},Plot[Sin[x],{x,0,Pi},p1-> q]], {{p,{PlotLabel-> None}, "Options"},Thread[{Options[Plot]}]},{{q,Null,"Value"},InputField}]$\endgroup$