p1 = {{1, 2}, {2, 5}, {3, 6}};

p2 = {{10, 2.03}, {4, 5.06}, {7, 6.02}};
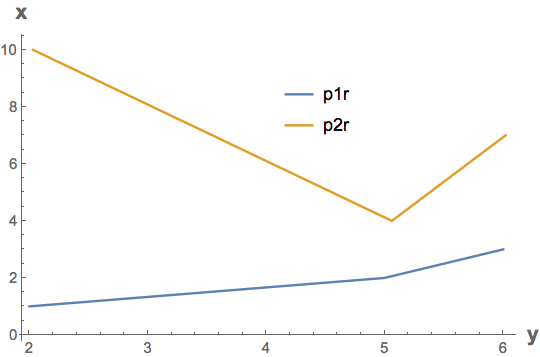
Since you want to compare values of x for comparable values of y, reverse the coordinates of the points.
p1r = Reverse /@ p1;

p2r = Reverse /@ p2;

ListLinePlot[{p1r, p2r},
 AxesLabel -> (Style[#, Bold, 14] & /@ {"y", "x"}),
 PlotLegends -> Placed[{"p1r", "p2r"}, {.6, .75}]]

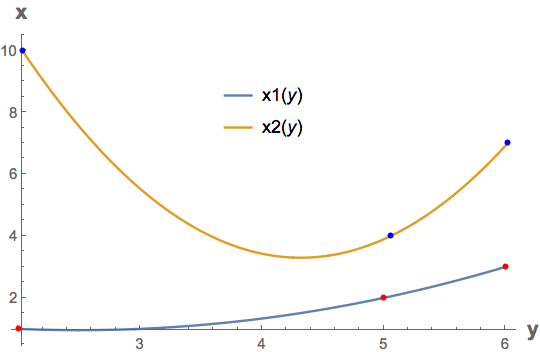
To use Interpolation
x1 = Interpolation[p1r, InterpolationOrder -> 2];

x2 = Interpolation[p2r, InterpolationOrder -> 2];

Plot[{x1[y], x2[y]}, {y, 2.03, 6},
 Epilog -> {AbsolutePointSize[4],
   Red, Point[p1r], Blue, Point[p2r]},
 AxesLabel -> (Style[#, Bold, 14] & /@ {"y", "x"}),
 PlotLegends -> Placed["Expressions", {.5, .75}]]

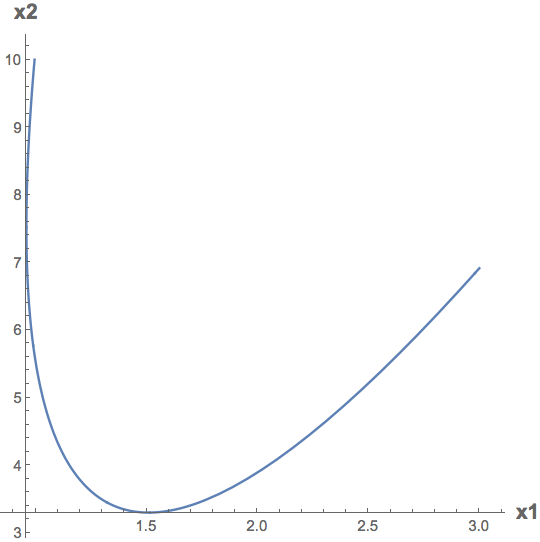
Use ParametricPlot to plot x2 versus x1
ParametricPlot[{x1[y], x2[y]}, {y, 2.03, 6}, AspectRatio -> 1,
 AxesLabel -> (Style[#, Bold, 14] & /@ {"x1", "x2"})]

x2 is not expressible as a function of x1 since the relationship is not single-valued over the range of interest. You could either restrict the range of interest to where the relationship is single-valued or break the range into regions using Piecewise, and then use NonlinearModelFit.


p1andp2consisted of more values that might change how this problem could be approached. $\endgroup$