1
$\begingroup$

I have plots of two datasets that have almost the same values on the y-axis but different values on the x-axis. lets suppose p1={x1,y1} and p1={x2,y2}. y1 and y2 have almost the same value, for example y1 = 2 and y2 = 2.05. How can I equate x1 with x2 by comparing the y1 and y2 values?

I used this code but it doesn't work:

p1=[{{1,2}, {2,5}, {3,6}}
p2={{10,2.03}, {4,5.06}, {7,6.02}};
p1x = Interpolation[p1];
p2x = Interpolation[p2];
Plot[p1x[p2x[V]], {V, 0, 9}]  

Thanks.

$\endgroup$
6
  • 1
    $\begingroup$ What have you tried? At a minimum, provide two representative data sets. $\endgroup$
    – Bob Hanlon
    Commented Jun 2, 2018 at 20:11
  • $\begingroup$ i used mathematica. $\endgroup$
    – Rabia
    Commented Jun 2, 2018 at 20:17
  • $\begingroup$ Copy and paste into your question (in Raw InputForm) a minimal working example of what you did in Mathematica. $\endgroup$
    – Bob Hanlon
    Commented Jun 2, 2018 at 20:21
  • $\begingroup$ P1x = Interpolation[P1] P2x = Interpolation[P2] Plot[ P1x[P2x[V]], {V, 0, 9}] $\endgroup$
    – Rabia
    Commented Jun 2, 2018 at 20:45
  • $\begingroup$ Are your datasets usually this small? If p1 and p2 consisted of more values that might change how this problem could be approached. $\endgroup$
    – C. E.
    Commented Jun 2, 2018 at 21:04

1 Answer 1

1
$\begingroup$
p1 = {{1, 2}, {2, 5}, {3, 6}};

p2 = {{10, 2.03}, {4, 5.06}, {7, 6.02}};

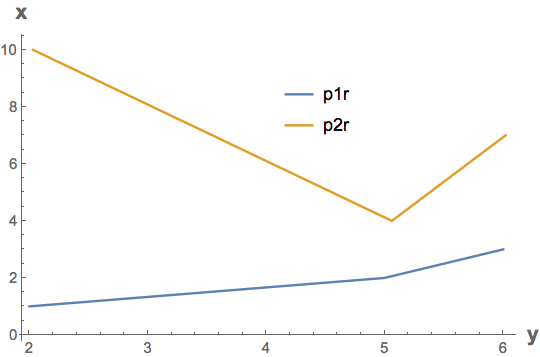
Since you want to compare values of x for comparable values of y, reverse the coordinates of the points.

p1r = Reverse /@ p1;

p2r = Reverse /@ p2;

ListLinePlot[{p1r, p2r}, 
 AxesLabel -> (Style[#, Bold, 14] & /@ {"y", "x"}), 
 PlotLegends -> Placed[{"p1r", "p2r"}, {.6, .75}]]
enter image description here

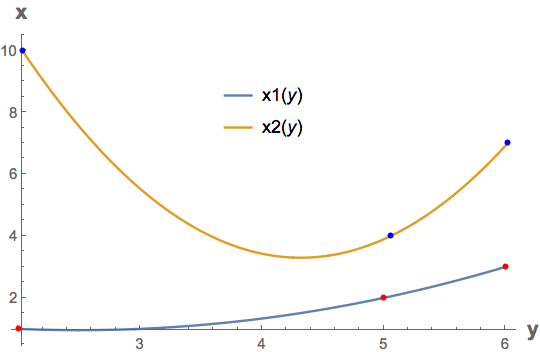
To use Interpolation

x1 = Interpolation[p1r, InterpolationOrder -> 2];

x2 = Interpolation[p2r, InterpolationOrder -> 2];

Plot[{x1[y], x2[y]}, {y, 2.03, 6},
 Epilog -> {AbsolutePointSize[4],
   Red, Point[p1r], Blue, Point[p2r]},
 AxesLabel -> (Style[#, Bold, 14] & /@ {"y", "x"}),
 PlotLegends -> Placed["Expressions", {.5, .75}]]
enter image description here

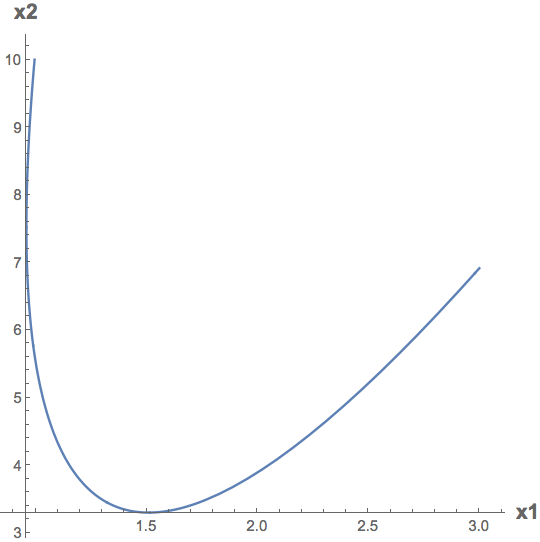
Use ParametricPlot to plot x2 versus x1

ParametricPlot[{x1[y], x2[y]}, {y, 2.03, 6}, AspectRatio -> 1, 
 AxesLabel -> (Style[#, Bold, 14] & /@ {"x1", "x2"})]
enter image description here

x2 is not expressible as a function of x1 since the relationship is not single-valued over the range of interest. You could either restrict the range of interest to where the relationship is single-valued or break the range into regions using Piecewise, and then use NonlinearModelFit.

$\endgroup$
1
  • $\begingroup$ Thank you Bob Hanlon $\endgroup$
    – Rabia
    Commented Jun 3, 2018 at 17:16

Your Answer

By clicking “Post Your Answer”, you agree to our terms of service and acknowledge you have read our privacy policy.

Not the answer you're looking for? Browse other questions tagged or ask your own question.