7
$\begingroup$

Bug introduced in 11.2 and fixed in 12.0

[CASE: 4033672] confirmed


Update

I have created a fix for this issue, which can be found in my answer below.

Note

This issue (in an even worse form) occurs in the code of this question, but from what I could tell, this was not an issue back then, since the question asks about something else (and the answers are also broken, so I guess we can assume that this issue was introduced after that point)

Problem description

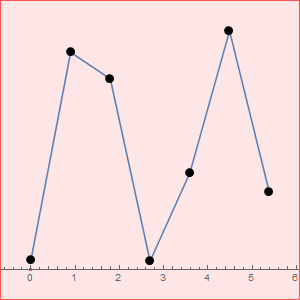
It appears ListPolarPlot is completely broken when using Joined->True together with PlotMarkers->Automatic:

ListPolarPlot[Table[1, 10], Joined -> True, PlotMarkers -> Automatic]

Mathematica graphics

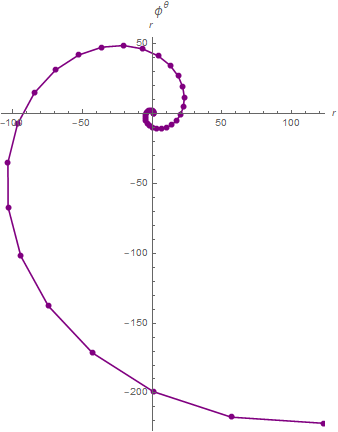
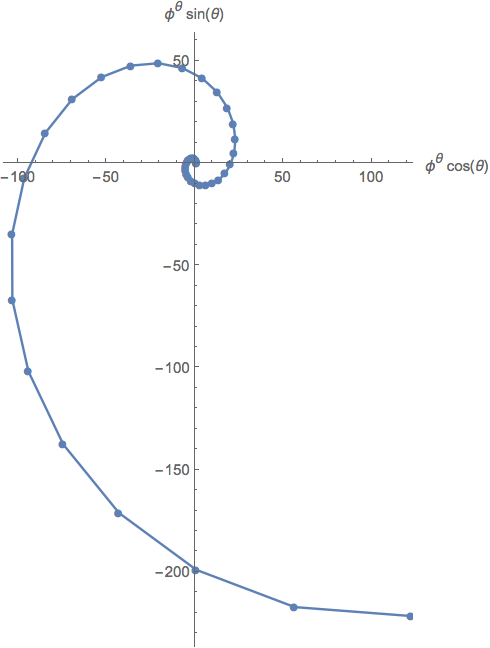
Both options are used explicitly in the documentation of ListPolarPlot, so they should work. It appears that the developers are at least partly aware of this issue, as the following example uses Mesh->True instead of PlotMarkers->Automatic:

ListPolarPlot[
 Table[{θ, GoldenRatio^θ}, {θ, 0, 4 Pi, 0.25}], 
 Joined -> True, AxesLabel -> {r, r}, 
 PlotLabel -> GoldenRatio^θ, 
 PlotStyle -> Directive[PointSize[Medium], Purple], Mesh -> All]

Mathematica graphics

Is there something I'm missing or is this just a simple bug? Also, how can I work around this properly? Mesh doesn't seem to be ideal for multiple curves in one plot...

$\endgroup$
2
  • $\begingroup$ Looks like it got broken in version 11; ListPolarPlot[Table[1, {10}], Joined -> True, PlotMarkers -> Automatic] works fine in version 10.4. $\endgroup$ Commented Mar 19, 2018 at 19:34
  • $\begingroup$ It appears to have been broken in 11.2, 11.1 still works as expected. I have notified WRI and will add the bug header once confirmed. $\endgroup$
    – Lukas Lang
    Commented Mar 21, 2018 at 13:03

3 Answers 3

6
$\begingroup$

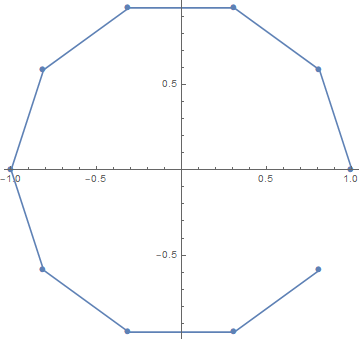
I think I have found a fix that properly restores the behavior of ListPolarPlot (explanation below):

(* execute once to fix issue *)
ListPlot@{};
If[$VersionNumber==11.2,
  Begin["System`ProtoPlotDump`"],
  Begin["System`ListPlotsDump`"]
];
SubValues@iListPlot = SubValues@iListPlot /. 
  HoldPattern[a : (graphicsoptions = _)] :> 
    (a; AppendTo[method, "OptimizePlotMarkers" -> optimizemarkers]);
End[];

This injects a single line into the definition of iListPlot to restore the proper behavior of ListPolarPlot:

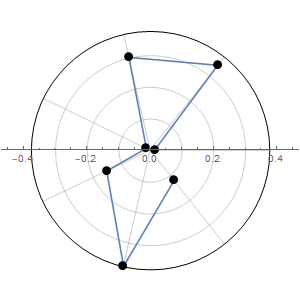
(* the original example *)
ListPolarPlot[Table[1, 10], Joined -> True, PlotMarkers -> Automatic]
(* from https://mathematica.stackexchange.com/questions/19923/listpolarplot-labelling-points-on-the-plot *)
ListPolarPlot[
 Tooltip /@ {0.01422, 0.3425217, 0.30036, 0.013, 0.152, 0.3762, 
   0.122}, Joined -> True, 
 PlotMarkers -> Graphics@Disk[{0, 0}, Scaled[0.025]], 
 Axes -> {True, False}, PolarAxes -> Automatic, 
 PolarGridLines -> {{0.897, 0.897*2, 0.897*3, 0.897*4, 0.897*5, 
    0.897*6, 0.897*7}, {0.1, 0.2, 0.3}}, PolarTicks -> None, 
 AspectRatio -> 1/1, ImageSize -> {300, 300}]

Before
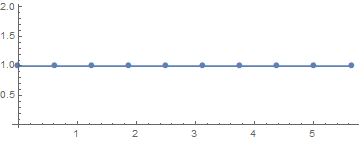
After
Explanation

Note: To see the definitions I'm talking about, load <<GeneralUtilities` and use PrintDefinitions@symbol to get a readable version of the definitions. Also, the symbols have moved from System`ProtoPlotDump` in 11.2 to System`ListPlotsDump` in 11.3 (the below always refers to the 11.3 contexts).

The issue

  • ListPolarPlot internally calls ListPlot (via Graphics`PolarPlotDump`listPolarPlot), and then transforms the result by interpreting the x-Axis as the angle and the y-Axis as the radius (see Graphics`PolarPlotDump`cleanup).
  • Graphics`PolarPlotDump`cleanup only works on GraphicsComplex, so Graphics`PolarPlotDump`listPolarPlot calls ListPlot with "OptimizePlotMarkers"->False, which should prevent a Normalization of the GraphicsComplex to a simple list of coordinates.
  • In 11.2, the code handling "OptimizePlotMarkers" was moved from System`ListPlotsDump`iListPlot to System`ListPlotsDump`postProcessLayout, but the option is never properly forwarded to that function.
  • This causes the GraphicsComplex to be Normalized, which in turn causes Graphics`PolarPlotDump`cleanup to fail.

The fix

  • Since System`ListPlotsDump`postProcessLayout reads out the method parameter to determine the value of "OptimizePlotMarkers", we simply need to add the setting to that list to forward it.
  • We have to do it after graphicsoptions is built, since System`ListPlotsDump`renderLayoutProcess silently crashes the kernel if the Method option contains the "OptimizePlotMarkers" setting.
$\endgroup$
2
$\begingroup$

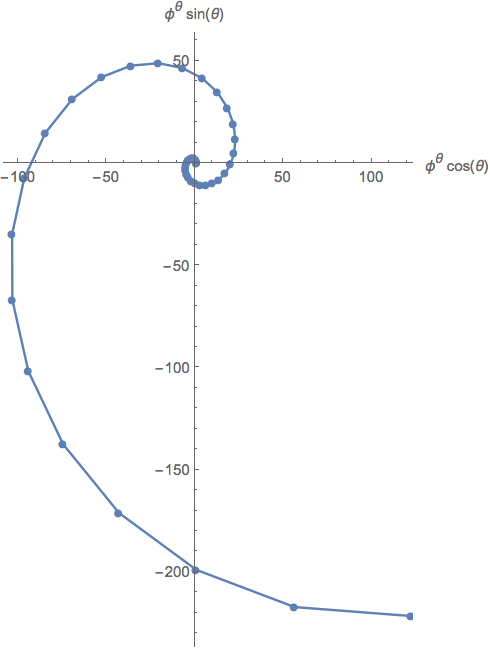
As workaround you can use either ListPlot or ListLinePlot

x[r_, t_] = r Cos[t];
y[r_, t_] = r Sin[t];

ListPlot[Table[#[GoldenRatio^θ, θ] & /@ {x, y}, {θ, 0, 
   4 Pi, 0.25}],
 Joined -> True,
 PlotMarkers -> Automatic,
 AspectRatio -> 1.5, 
 AxesLabel -> (#[GoldenRatio^θ, θ] & /@ {x, y})]

enter image description here

ListLinePlot[
 Table[#[GoldenRatio^θ, θ] & /@ {x, y}, {θ, 0, 4 Pi, 
   0.25}],
 PlotMarkers -> Automatic
 , AspectRatio -> 1.5, 
 AxesLabel -> (#[GoldenRatio^θ, θ] & /@ {x, y})]

enter image description here

$\endgroup$
1
  • 1
    $\begingroup$ Unfortunately, I don't see how I can use PolarGridLines and similar with this approach. But for simpler cases, this is surely an easy fix. $\endgroup$
    – Lukas Lang
    Commented Mar 23, 2018 at 0:30
1
$\begingroup$

Another solution is plot the figure with ListPolarPlot without using PlotMarkers and then replace the points in the figure with the shape you want. For example,

fig /. {Point[x__] :> (Circle[#, 0.03] & /@ x)}
$\endgroup$

Your Answer

By clicking “Post Your Answer”, you agree to our terms of service and acknowledge you have read our privacy policy.

Not the answer you're looking for? Browse other questions tagged or ask your own question.