2
$\begingroup$

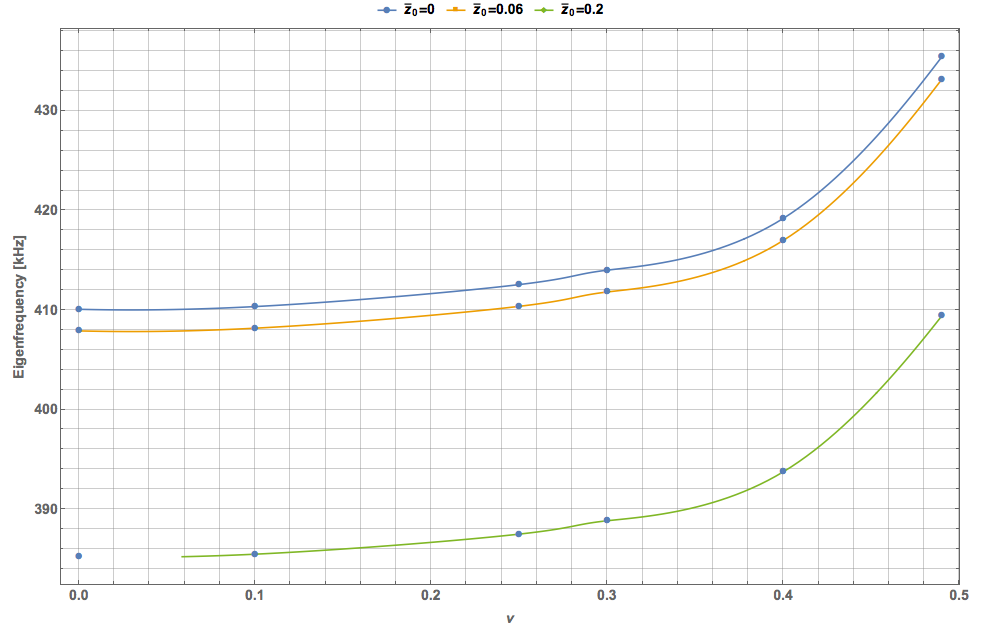
I have some data I need to plot smoothly. I am using ListPlot and Joined; to make them smooth, I found I need to use InterpolationOrder->3; then, to have only markers on the data set, I am using Mesh->Full, but I get some weird behavior. Colors of markers are only blue and a part of the third curve vanishes. How do I get markers with colors of the curve, different for each curve?

Z00 = {{0.`, 410.07215877001596`}, {0.1`, 410.346099148169`}, {0.25`, 
412.554711875091`}, {0.3`, 414.003252267871`}, {0.4`, 
419.207372319724`}, {0.49`, 435.436031631739`}};

Z006 = {{0.`, 407.90130077490403`}, {0.1`, 
408.17433459836303`}, {0.25`, 410.370028165589`}, {0.3`, 
411.81120194816503`}, {0.4`, 416.99501296245097`}, {0.49`, 
433.178028406407`}};

Z002 = {{0.`, 385.219627658663`}, {0.1`, 385.47437566168`}, {0.25`, 
387.49055954758103`}, {0.3`, 388.83276041643103`}, {0.4`, 
393.75318408081097`}, {0.49`, 409.415785093289`}};

ListPlot[{Z00, Z006, Z002}, PlotMarkers -> {Automatic, 10}, 
Joined -> True, Mesh -> Full, InterpolationOrder -> 3, 
PlotRange -> All, 
GridLines -> All, ImageSize -> {1000, 600}, Frame -> True, 
FrameLabel -> {"poisson", "Eigenfrequency [kHz]"}, 
LabelStyle -> Directive[FontWeight -> "Bold", FontSize -> 14]]

enter image description here

$\endgroup$

2 Answers 2

2
$\begingroup$

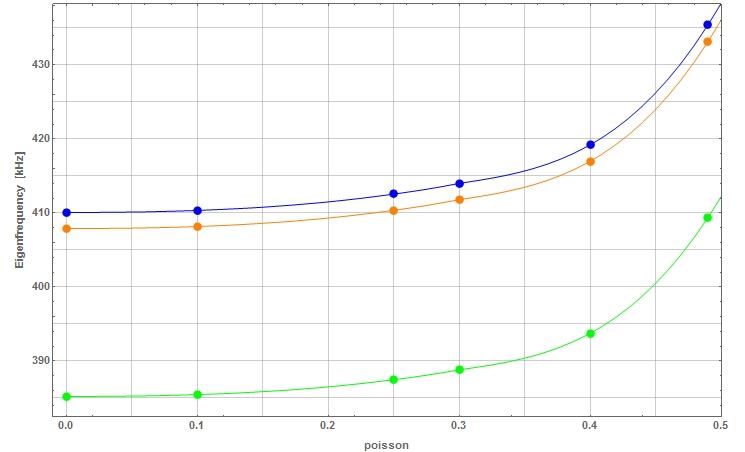
Try this:

in1 = Interpolation[Z00, InterpolationOrder -> 3];
in2 = Interpolation[Z006, InterpolationOrder -> 3];
in3 = Interpolation[Z002, InterpolationOrder -> 3];

Show[{
  ListPlot[{Z00, Z006, Z002}, Mesh -> Full, PlotRange -> All, 
   GridLines -> All, ImageSize -> {1000, 600}, Frame -> True, 
   FrameLabel -> {"poisson", "Eigenfrequency [kHz]"}, 
   LabelStyle -> Directive[FontWeight -> "Bold", FontSize -> 14]],

  Plot[{in1[x], in2[x], in3[x]}, {x, 0, 0.5}]
  }]

yielding this

enter image description here

Have fun!

$\endgroup$
4
  • $\begingroup$ good trick! Thanks $\endgroup$
    – Andrea G
    Commented Dec 7, 2017 at 14:27
  • $\begingroup$ On V11.2 (MacOS), all the mesh points are the same color. I thought they were the plot markers, but after looking further, I found I needed to omit Mesh -> Full in the ListPlot. (Your image also does not have the standard V11 colors, which makes me think you're using a different version or options.) $\endgroup$
    – Michael E2
    Commented Dec 7, 2017 at 14:50
  • $\begingroup$ @ Michael E2 I use Win7. Yes, I also noticed something strange. Namely, if I took the ImageSize used by the author, I obtained what you see in my answer, but as soon as I decreased the size (just to comfortably publish the image) all the dots strangely became blue, while the lines appeared as in the image. I did not dig into it. After all the OP wanted this size. $\endgroup$ Commented Dec 7, 2017 at 15:23
  • $\begingroup$ I see. I get that, too. I automatically delete ImageSize from code -- I find it annoying. I didn't realize its significance. I assume on size is absolute and one size is relative. $\endgroup$
    – Michael E2
    Commented Dec 8, 2017 at 13:16
1
$\begingroup$

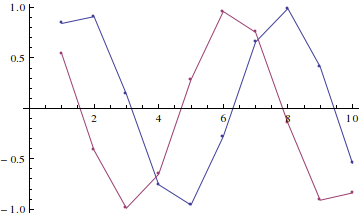
A cleaner way, without the need to combine multiple plots of the same data with Show, is to use PlotMarkers option instead of Mesh->Full. If you use PlotMarkers->Automatic, as this StackOverflow answer does, you'll get the default sequence of markers like circles, squares etc. To get simply colored points, you can do like here:

ListPlot[Transpose@Table[{Sin[n], Cos[n]}, {n, 1, 10}],
 Joined -> True, PlotMarkers -> Graphics@{Point[{0, 0}]}]

output of the above command

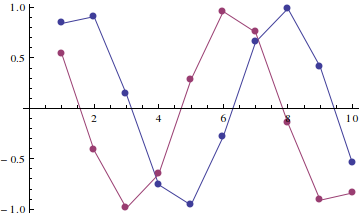
You can use all the normal elements of Graphics sequence, e.g. to make points larger you'd use

ListPlot[Transpose@Table[{Sin[n], Cos[n]}, {n, 1, 10}], 
 Joined -> True, PlotMarkers -> Graphics@{PointSize[Large], Point[{0, 0}]}]

output of the above command

$\endgroup$
3
  • $\begingroup$ PlotMarkers -> Automatic is also possible $\endgroup$
    – partida
    Commented Feb 27, 2019 at 10:54
  • $\begingroup$ @partida I did mention this option in this answer, please read the first paragraph on how it doesn't (quite) work. $\endgroup$
    – Ruslan
    Commented Feb 27, 2019 at 14:25
  • $\begingroup$ Oh, Excuse me I read carelessly. $\endgroup$
    – partida
    Commented Feb 28, 2019 at 2:43

Your Answer

By clicking “Post Your Answer”, you agree to our terms of service and acknowledge you have read our privacy policy.

Not the answer you're looking for? Browse other questions tagged or ask your own question.