7
$\begingroup$

I've been trying to draw a polar plot using the ListPolarPlot function with custom marker shapes. However, when I use PlotMarkers several errors appear (see attached screenshot). In the past I have successfully used PlotMarkers with ListPlot, so the problem seems to be ListPolarPlot.

Screenshot showing errors when using PlotMarkers

So far I've only been able to change the colour and size of the points by using PlotStyle, but cannot find a way to change their shape:

Data = {{0, 70}, {π/12, 45}, {π/6, 60}, {π/4, 90}, {π/2, 30}}

ListPolarPlot[Data, PolarAxes -> True, PolarGridLines -> Automatic, 
  Joined -> False, PolarTicks -> {"Degrees", Automatic}, 
  BaseStyle -> {FontWeight -> Bold, FontSize -> 12}, 
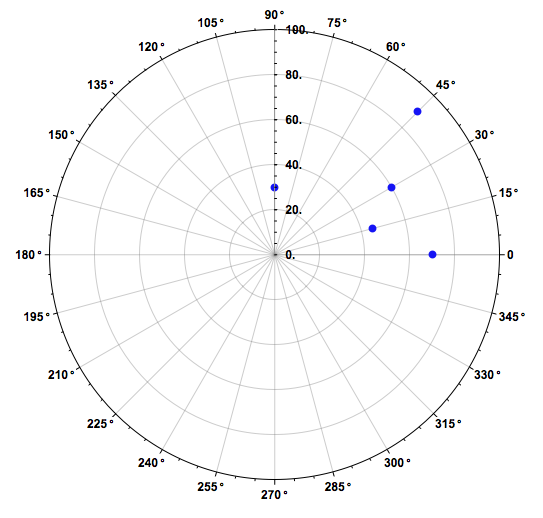
  PlotStyle -> {Blue, PointSize -> 0.014}]

enter image description here

$\endgroup$
10
  • 1
    $\begingroup$ I cut and pasted your code, added PlotMarkers -> \[FilledUpTriangle] and it worked fine. I am using "12.0.0 for Mac OS X x86 (64-bit) (April 7, 2019)". $\endgroup$ Commented Oct 16, 2019 at 0:31
  • 1
    $\begingroup$ I just tried it on 11.3 and it fails with the same errors you reported. $\endgroup$ Commented Oct 16, 2019 at 0:38
  • 2
    $\begingroup$ does ListPolarPlot[Data, PolarAxes -> True, PolarGridLines -> Automatic, Joined -> False, PolarTicks -> {"Degrees", Automatic}, BaseStyle -> {FontWeight -> Bold, FontSize -> 12}, PlotStyle -> {Blue, PointSize -> 0.014}]/. Point[x_]:>( Text["\[FilledUpTriangle]",#]&/@x) work in your version/OS? $\endgroup$
    – kglr
    Commented Oct 16, 2019 at 0:50
  • 1
    $\begingroup$ @kglr That works for me on 11.3 Mac OS. $\endgroup$ Commented Oct 16, 2019 at 0:53
  • 2
    $\begingroup$ Possible duplicate of ListPolarPlot broken by PlotMarkers & Joined - the exact circumstances are a bit different there, but the fix proposed there works as well for this case $\endgroup$
    – Lukas Lang
    Commented Oct 16, 2019 at 8:36

4 Answers 4

5
$\begingroup$

Use the option PlotMarkers

$Version

(* "12.0.0 for Mac OS X x86 (64-bit) (April 7, 2019)" *)

Data = {{0, 70}, {π/12, 45}, {π/6, 60}, {π/4, 90}, {π/2, 30}};

ListPolarPlot[Data, PolarAxes -> True, PolarGridLines -> Automatic, 
 Joined -> False, PolarTicks -> {"Degrees", Automatic}, 
 BaseStyle -> {FontWeight -> Bold, FontSize -> 12}, 
 PlotStyle -> {Blue, PointSize -> 0.014},
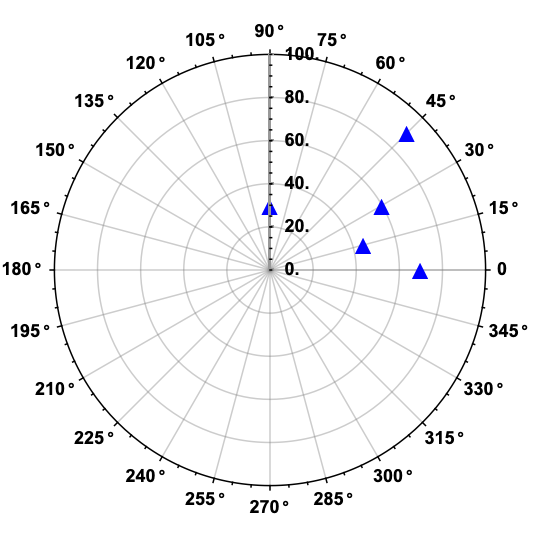
 PlotMarkers -> {Style[▲, 20]},
 PlotRangePadding -> Scaled[.1]]

enter image description here

$\endgroup$
4
$\begingroup$

Per Rohit's comment post-processing Points into desired text marker works in v11.3 (Mac OS):

ListPolarPlot[Data, 
   PolarAxes -> True, 
   PolarGridLines -> Automatic, 
   Joined -> False, 
   PolarTicks -> {"Degrees", Automatic}, 
   BaseStyle -> {FontWeight -> Bold, FontSize -> 12}, 
   PlotStyle -> {Blue, PointSize -> 0.014}
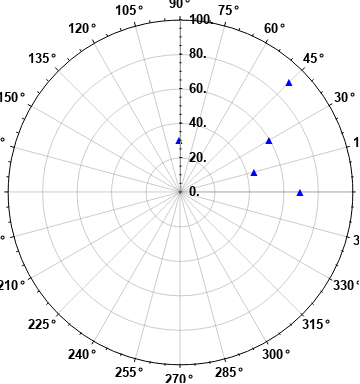
 ] /. Point[x_] :> (Text["▲", #]& /@ x)

enter image description here

$\endgroup$
3
$\begingroup$

As noted in the comments, this is a bug that was introduced in 11.2 and fixed in 12.0. The fix for versions 11.2 and 11.3 is to execute the code below once:

(* execute once to fix issue *)
ListPlot@{};
If[$VersionNumber==11.2,
  Begin["System`ProtoPlotDump`"],
  Begin["System`ListPlotsDump`"]
];
SubValues@iListPlot = SubValues@iListPlot /. 
  HoldPattern[a : (graphicsoptions = _)] :> 
    (a; AppendTo[method, "OptimizePlotMarkers" -> optimizemarkers]);
End[];

Now everything works as expected:

$Version
(* "11.3.0 for Mac OS X x86 (64-bit) (March 7, 2018)" *)

Data = {{0, 70}, {π/12, 45}, {π/6, 60}, {π/4, 
    90}, {π/2, 30}};

ListPolarPlot[
 Data,
 PolarAxes -> True,
 PolarGridLines -> Automatic,
 Joined -> False,
 PolarTicks -> {"Degrees", Automatic},
 BaseStyle -> {FontWeight -> Bold, FontSize -> 12},
 PlotStyle -> {Blue, PointSize -> 0.014},
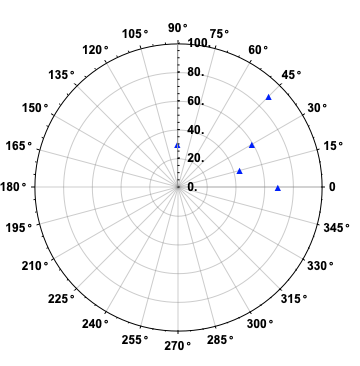
 PlotMarkers -> ▲
 ]

enter image description here

An explanation of how this fix works can be found in this answer.

$\endgroup$
0
$\begingroup$

PlotMarkers seems to work fine with both Mathematica v.12 (as per comments/answer posted by @Rohit Namjoshi and @Bob Hanlon, respectively) and v.10.0 (it ran perfectly when I tried it just now). It seems to be an issue in v.11.3 where PlotMarkers conflicts with PolarAxes.

$\endgroup$
1
  • 3
    $\begingroup$ There is no version 11 or version 10. There are 10.0, 10.1, 11.0, 11.1, etc. Please be specific. $\endgroup$
    – Szabolcs
    Commented Oct 16, 2019 at 8:10

Not the answer you're looking for? Browse other questions tagged or ask your own question.